Graphics with R ggplot2

R Graphics cookbook examples
This whole page is created with the purpose of show you how flexible and power full is ggplot2 with a few examples to create fancy plots ready to publish, almost all the examples were extracted from https://r-graphics.org/.
http://www.stat.columbia.edu/~tzheng/files/Rcolor.pdf
if(!require("gcookbook")){
    install.packages("gcookbook")# paquete con los dataset usados en el libro
    library("gcookbook")
}
library(ggplot2)
library(tidyverse)
library(ggrepel)
library(MASS)
library(magrittr)
Creating a line graph
ggplot(BOD, aes(x = Time, y = demand)) +
    geom_line()
BOD ## Time demand
## 1 1 8.3
## 2 2 10.3
## 3 3 19.0
## 4 4 16.0
## 5 5 15.6
## 6 7 19.8BOD1 <- BOD # Make a copie of the data
BOD1$Time <- factor(BOD1$Time)
ggplot(BOD1, aes(x = Time, y = demand, group = 1)) + #ahora si esta bien
geom_line()
Expanding the x or y axis
ggplot(BOD1, aes(x = Time, y = demand, group = 1)) +
    geom_line()
ggplot(BOD, aes(x = Time, y = demand)) +# This have the same result
    geom_line() +
    ylim(0, max(BOD$demand))
xlim(min(BOD$Time), max(BOD$Time))## <ScaleContinuousPosition>
## Range:
## Limits: 1 -- 7Agregar puntos a un grafico de lineas
ggplot(pressure, aes(temperature,pressure)) +
        geom_point()+
        geom_line()
ggplot(BOD, aes(x = Time, y = demand)) +
    geom_line() +
    geom_point()
ggplot(worldpop, aes(x = Year, y = Population)) +
    geom_line() +
    geom_point()
log transformation
ggplot(worldpop, aes(x = Year, y = Population)) +
    geom_line() +
    geom_point() +
    scale_y_log10()
Multiple lines
tg## supp dose length
## 1 OJ 0.5 13.23
## 2 OJ 1.0 22.70
## 3 OJ 2.0 26.06
## 4 VC 0.5 7.98
## 5 VC 1.0 16.77
## 6 VC 2.0 26.14ggplot(tg, aes(x = dose, y = length, colour = supp)) +
geom_line()
ggplot(tg, aes(x = dose, y = length, linetype = supp)) +
    geom_line()
ggplot(tg, aes(x = factor(dose),
               y = length,
               colour = supp,
               group = supp,
               fill = supp,
               shape = supp)) +
    geom_line()+
    geom_point(size = 4)
ggplot(tg, aes(x = dose, y = length, shape = supp)) +
    geom_line(position = position_dodge(0.2)) +
    geom_point(position = position_dodge(0.2), size = 4)
Customize lines
ggplot(BOD, aes(x = Time, y = demand)) +
    geom_line(linetype = "dashed", size = 1, colour = "blue")
ggplot(tg, aes(x = dose, y = length, group = supp)) +
    geom_line(colour = "darkgreen", size = 1.5)
ggplot(tg, aes(x = dose, y = length, colour = supp)) +
    geom_line(linetype = "dashed") +
    geom_point(shape = 22, size = 3, fill = "white")
Boxplot
ggplot(BOD, aes(x = Time, y = demand)) +
        geom_col()
ggplot(ToothGrowth, aes(x = interaction(supp, dose), y = len)) +
geom_boxplot() 
outliers
ggplot(birthwt, aes(x = factor(race), y = bwt)) +
    geom_boxplot(outlier.size = 1.5,
                 outlier.shape = 21)# Define the outlier shape
Notched boxplot
ggplot(birthwt, aes(x = factor(race), y = bwt)) +
    geom_boxplot(notch = TRUE)
## notch went outside hinges. Try setting notch=FALSE.
ggplot(birthwt, aes(x = factor(race), y = bwt)) +
    geom_boxplot() +
    stat_summary(fun.y = "mean",
                 geom = "point",
                 shape = 23,
                 size = 3,
                 fill = "white")
Violin plot
hw_p <- ggplot(heightweight, aes(x = sex, y = heightIn))

hw_p +
    geom_violin()
hw_p +
    geom_violin()+
    geom_boxplot()
hw_p +
    geom_violin(trim = F,
                scale = "count") +
    geom_boxplot(width = .1,
                 fill = "black",
                 outlier.colour = NA) +
    stat_summary(fun.y = median,
                 geom = "point",
                 fill = "white",
                 shape = 21,
                 size = 2.5)
hw_p +
geom_violin(adjust = 2) 
hw_p +
    geom_violin(adjust = 0.4)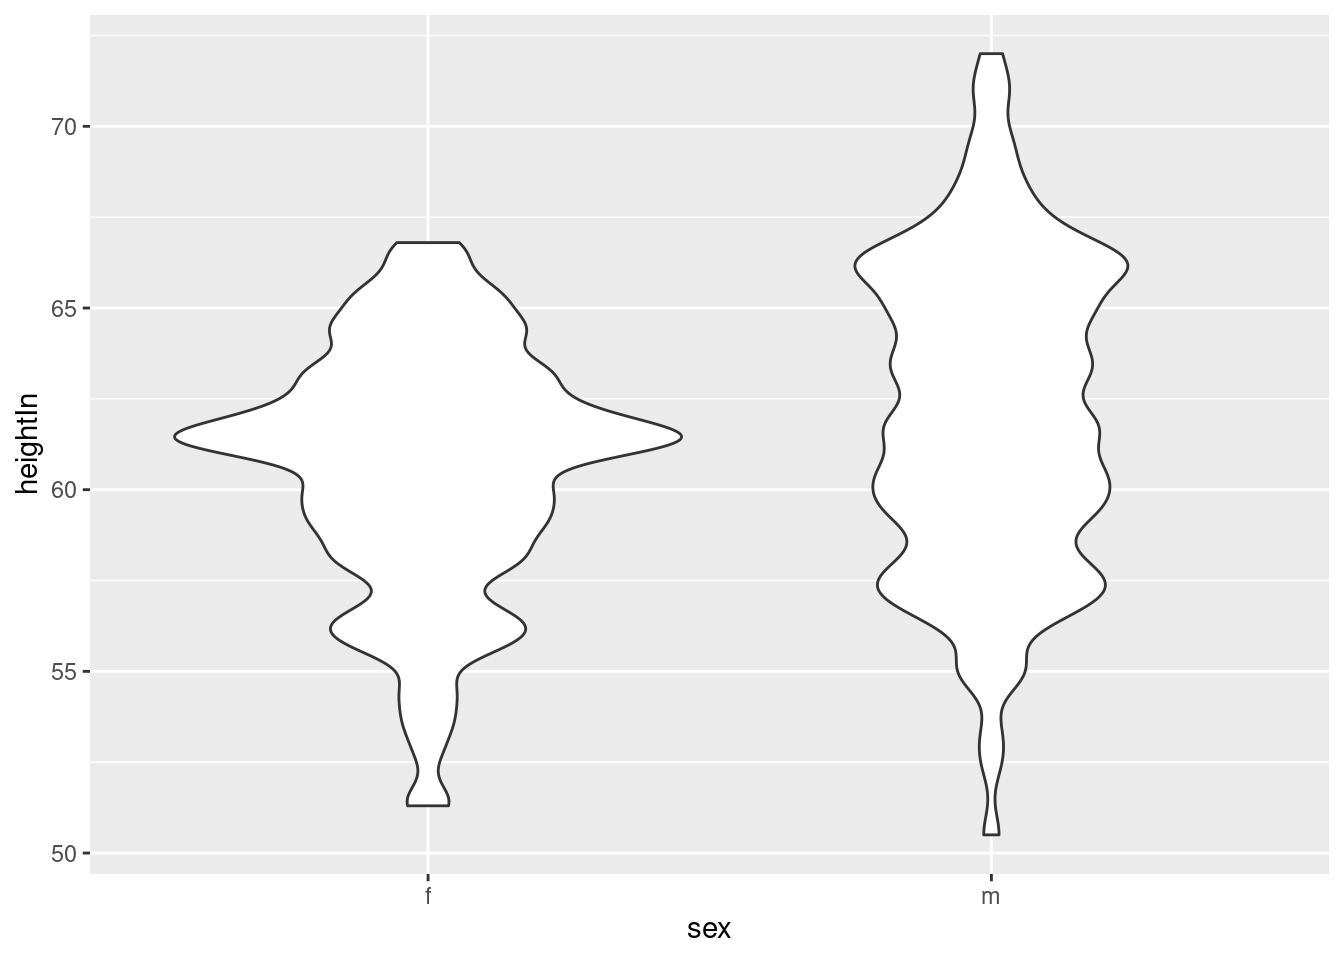
Bar Graph
ggplot(mtcars, aes(x = cyl)) +
        geom_bar()
ggplot(mtcars, aes(x = factor(cyl))) +
        geom_bar()
Bind bars
ggplot(cabbage_exp, aes(x = Date, y = Weight, fill = Cultivar, )) +
        geom_col(position = "dodge", colour = "gray30") +
        scale_fill_brewer(palette = "Pastel1")
ggplot(diamonds, aes(x = cut)) +
geom_bar() 
Rearrange bars
ups <- uspopchange
ups %<>% arrange(.,desc(Change)) %>%
        slice(1:10)
ggplot(ups, aes(reorder(Abb,Change),ups$Change, fill= Region)) +
        geom_col()+
        xlab("State")+
        ylab("Change")
Giving color to the bars depending a condition
climate_sub <- climate %>%
        filter(Source == "Berkeley" & Year >= 1900) %>%
        mutate(pos = Anomaly10y >= 0)

ggplot(climate_sub, aes(x = Year, y = Anomaly10y, fill = pos)) +
        geom_col(position = "identity")
ggplot(climate_sub, aes(x = Year, y = Anomaly10y, fill = pos)) +
        geom_col(position = "identity", colour = "black", size = 0.25) +
        scale_fill_manual(values = c("#CCEEFF", "#FFDDDD"), guide = FALSE)
Adjust space and width
pg_mean ## group weight
## 1 ctrl 5.032
## 2 trt1 4.661
## 3 trt2 5.526ggplot(pg_mean, aes(x = group, y = weight)) +
geom_col()
ggplot(pg_mean, aes(x = group, y = weight)) +
        geom_col(width = 0.5)
ggplot(pg_mean, aes(x = group, y = weight)) +
        geom_col(width = 0.98, color = pg_mean$group)
ggplot(cabbage_exp, aes(x = Date, y = Weight, fill = Cultivar)) +
geom_col(width = 0.5, position = "dodge") 
ggplot(cabbage_exp, aes(x = Date, y = Weight, fill = Cultivar)) +
geom_col(width = 0.5, position = position_dodge(0.7)) 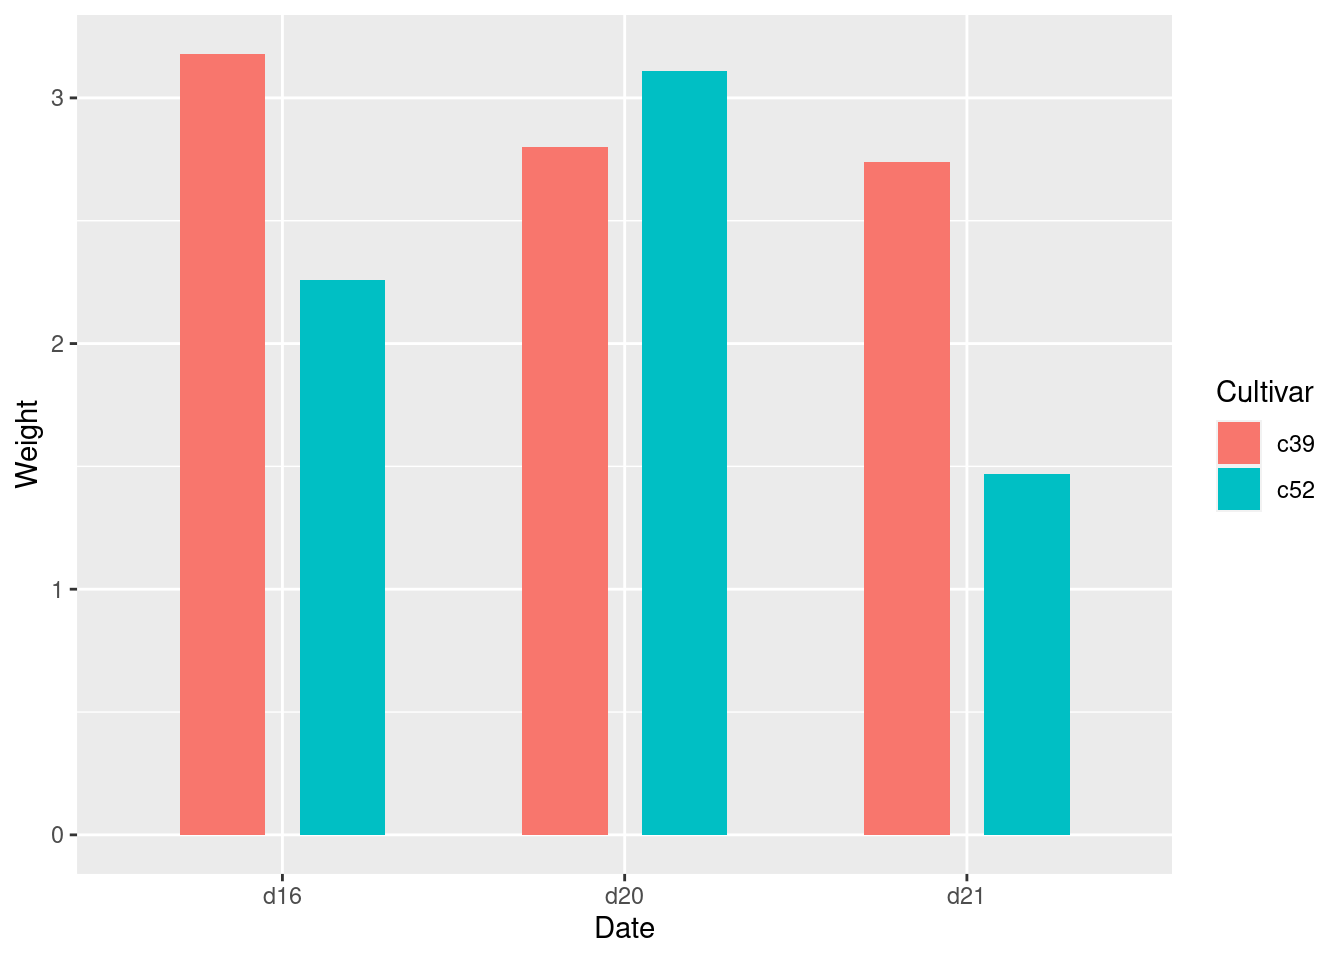
Stacked bar plot
cabbage_exp## Cultivar Date Weight sd n se
## 1 c39 d16 3.18 0.9566144 10 0.30250803
## 2 c39 d20 2.80 0.2788867 10 0.08819171
## 3 c39 d21 2.74 0.9834181 10 0.31098410
## 4 c52 d16 2.26 0.4452215 10 0.14079141
## 5 c52 d20 3.11 0.7908505 10 0.25008887
## 6 c52 d21 1.47 0.2110819 10 0.06674995ggplot(cabbage_exp, aes(x = Date, y = Weight, fill = Cultivar)) +
geom_col()
ggplot(cabbage_exp, aes(x = Date, y = Weight, fill = Cultivar)) +
geom_col() +
guides(fill = guide_legend(reverse = TRUE)) 
ggplot(cabbage_exp, aes(x = Date, y = Weight, fill = Cultivar)) +
        geom_col(colour = "black") +
scale_fill_brewer(palette = "Pastel1") 
Stacked bar plot by percent
ggplot(cabbage_exp, aes(x = Date, y = Weight, fill = Cultivar)) +
geom_col(position = "fill") 
ggplot(cabbage_exp, aes(x = Date, y = Weight, fill = Cultivar)) +
        geom_col(position = "fill") +
scale_y_continuous(labels = scales::percent) 
ggplot(cabbage_exp, aes(x = Date, y = Weight, fill = Cultivar)) +
        geom_col(colour = "black", position = "fill") +
        scale_y_continuous(labels = scales::percent) +
scale_fill_brewer(palette = "Pastel1") 
ce <- cabbage_exp %>%
        group_by(Date) %>%
        mutate(percent_weight = Weight / sum(Weight) * 100)

ggplot(ce, aes(x = Date, y = percent_weight, fill = Cultivar)) +
geom_col() 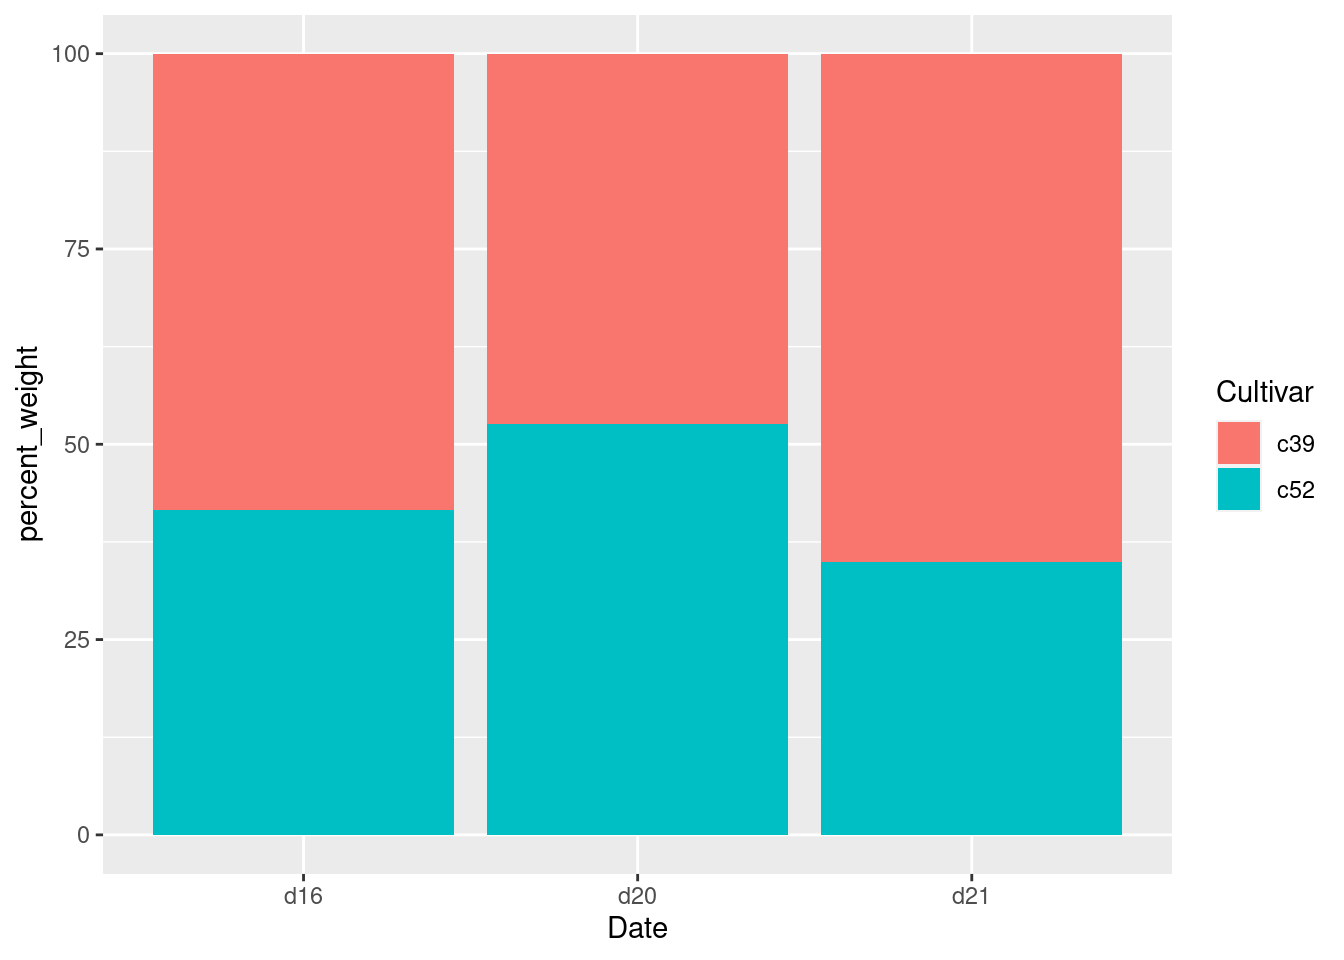
Adding labels to the columns
ggplot(cabbage_exp, aes(x = interaction(Date, Cultivar), y = Weight)) +

        geom_col() +
        geom_text(aes(label = Weight),
                  vjust = 1.5,
colour = "white") 
ggplot(cabbage_exp, aes(x = interaction(Date, Cultivar), y = Weight)) +
        geom_col() +
geom_text(aes(label = Weight), vjust = -0.2) 
mtcars$cyl %>% as.factor() %>% table() ## .
## 4 6 8
## 11 7 14ggplot(mtcars, aes(x = factor(cyl))) +
geom_bar() +
geom_text(aes(label = ..count..),
stat = "count",
vjust = 1.5,
colour = "white")
ce <- cabbage_exp %>%
        arrange(Date, rev(Cultivar))
ce <- ce %>%
        group_by(Date) %>%
        mutate(label_y = cumsum(Weight))
ce
## # A tibble: 6 × 7
## # Groups: Date [3]
## Cultivar Date Weight sd n se label_y
## <fct> <fct> <dbl> <dbl> <int> <dbl> <dbl>
## 1 c52 d16 2.26 0.445 10 0.141 2.26
## 2 c39 d16 3.18 0.957 10 0.303 5.44
## 3 c52 d20 3.11 0.791 10 0.250 3.11
## 4 c39 d20 2.8 0.279 10 0.0882 5.91
## 5 c52 d21 1.47 0.211 10 0.0667 1.47
## 6 c39 d21 2.74 0.983 10 0.311 4.21ggplot(ce, aes(x = Date, y = Weight, fill = Cultivar)) +
geom_col() +
geom_text(aes(y = label_y, label = Weight),
vjust = 1.5,
colour ="white")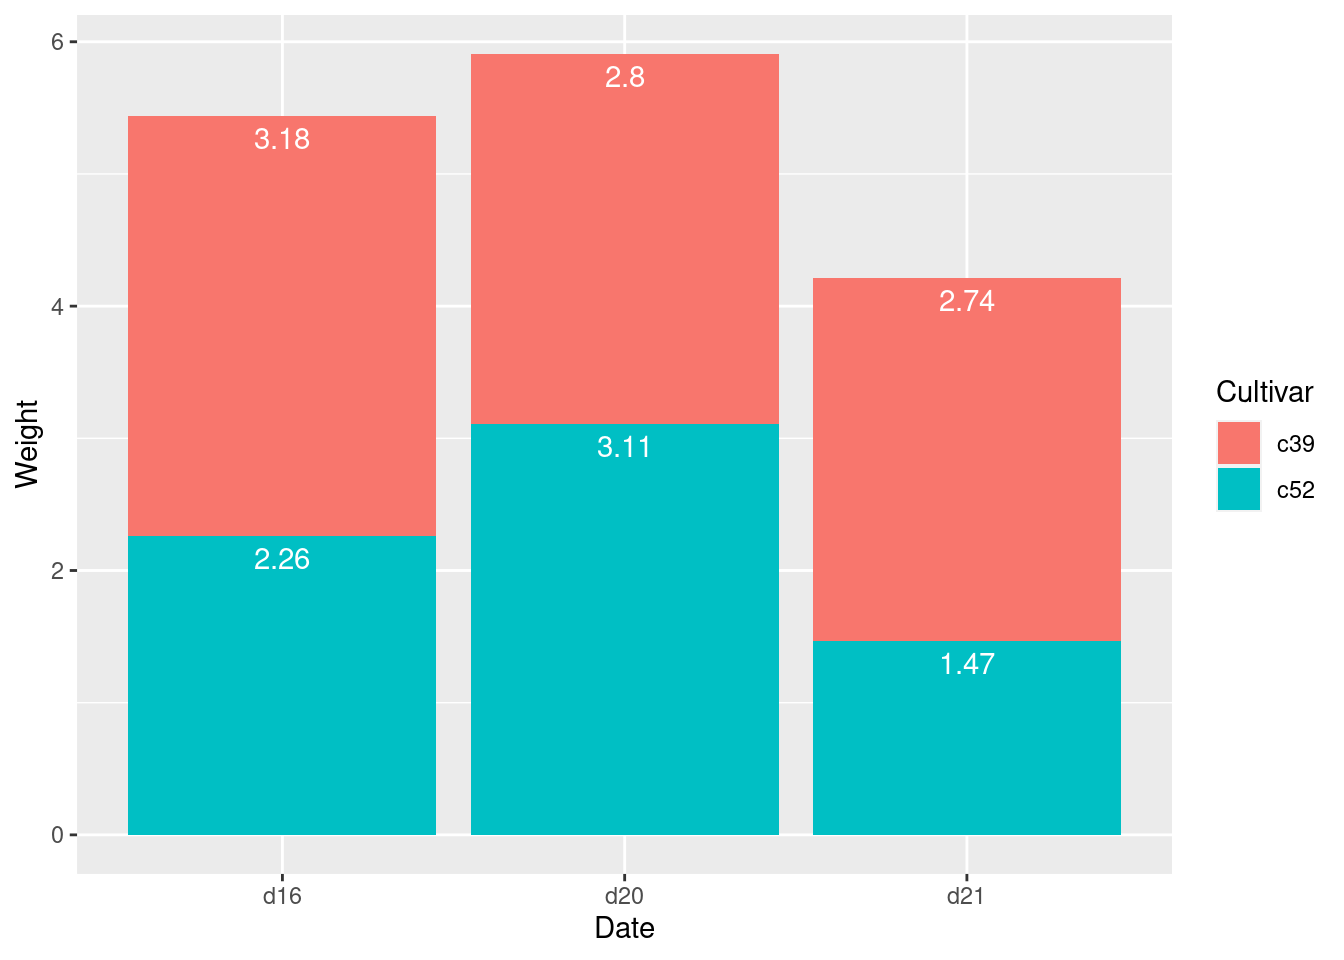
ce <- cabbage_exp %>%
        arrange(Date, rev(Cultivar))

ce <- ce %>%
        group_by(Date) %>%
        mutate(label_y = cumsum(Weight) - 0.5 * Weight)

ggplot(ce, aes(x = Date, y = Weight, fill = Cultivar)) +
        geom_col() +
        geom_text(aes(y = label_y, label = Weight),
                  colour = "white")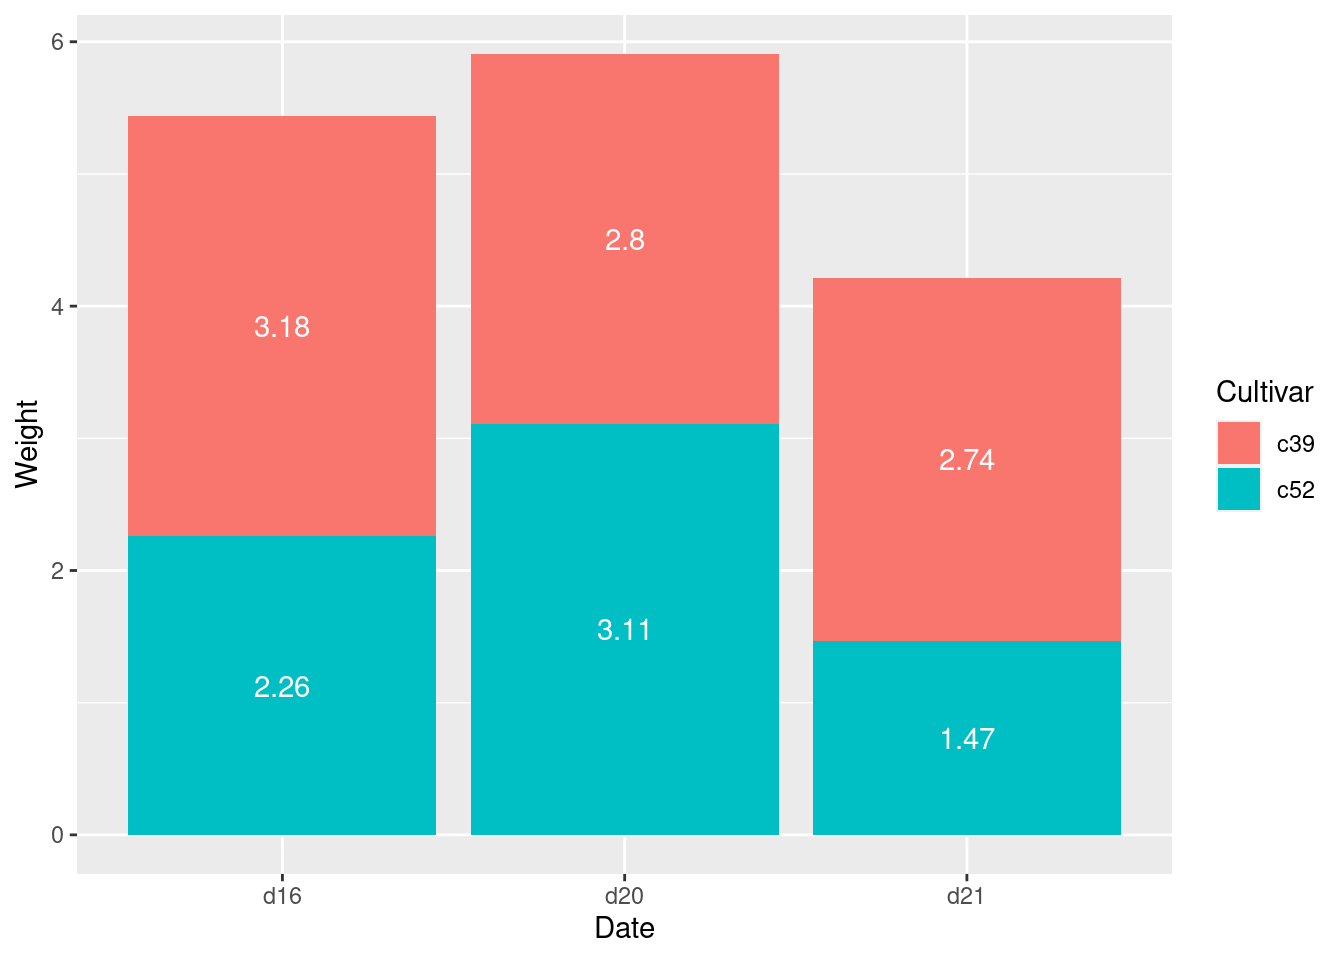
Modificar multiples labels a la vez
ggplot(ce, aes(x = Date, y = Weight, fill = Cultivar)) +
        geom_col(colour = "black") +
        geom_text(aes(y = label_y,
                      label = paste(format(Weight, nsmall = 2), "kg")),
                  size = 4) +
        scale_fill_brewer(palette = "Pastel1")
Expand the axis
ggplot(cabbage_exp, aes(x = interaction(Date, Cultivar), y = Weight)) +
        geom_col() +
        geom_text(aes(label = Weight), vjust = -0.2)
ggplot(cabbage_exp, aes(x = interaction(Date, Cultivar), y = Weight)) +
        geom_col() +
        geom_text(aes(label = Weight), vjust = -0.2) +
ylim(0, max(cabbage_exp$Weight) * 1.05) 
ggplot(cabbage_exp, aes(x = interaction(Date, Cultivar), y = Weight)) +
        geom_col() +
geom_text(aes(y = Weight + 0.1, label = Weight)) 
Cleaveland dot plot
tophit <- slice(tophitters2001,1:25) # subset
tophit <- tophit[, c("name", "lg", "avg")]
ggplot(tophit, aes(x = avg, y = name)) +
        geom_point() #ugly-plot
ggplot(tophit, aes(x = avg, y = reorder(name, avg))) +
    geom_point(size = 3) +
    theme_bw() +
    theme(panel.grid.major.x = element_blank(),
          panel.grid.minor.x = element_blank(),
          panel.grid.major.y = element_line(colour = "grey60",
                                            linetype = "dashed")
)
ggplot(tophit, aes(x = reorder(name, avg), y = avg)) +
    geom_point(size = 3) +
    theme_bw() +
    theme(panel.grid.major.y = element_blank(),
          panel.grid.minor.y = element_blank(),
          panel.grid.major.x = element_line(colour = "grey60",
                                            linetype = "dashed"),
          axis.text.x = element_text(angle = 60, hjust = 1)
)
##  Lolipop version
head(tophit)
## name lg avg
## 1 Larry Walker NL 0.3501
## 2 Ichiro Suzuki AL 0.3497
## 3 Jason Giambi AL 0.3423
## 4 Roberto Alomar AL 0.3357
## 5 Todd Helton NL 0.3356
## 6 Moises Alou NL 0.3314nameorder <- tophit$name[order(tophit$lg, tophit$avg)]
tophit$name <- factor(tophit$name, levels = nameorder)
ggplot(tophit, aes(x = avg, y = name)) +
geom_segment(aes(yend = name),
xend = 0,
colour = "grey50") +
geom_point(size = 3, aes(colour = lg)) +
scale_colour_brewer(palette = "Set1", limits = c("NL", "AL")) +
theme_bw() +
theme(panel.grid.major.y = element_blank(),
legend.position = c(1, 0.55),
legend.justification = c(1, 0.5)
)
## Another option

ggplot(tophit, aes(x = avg, y = name)) +
    geom_segment(aes(yend = name), xend = 0, colour = "grey50") +
    geom_point(size = 3, aes(colour = lg)) +
    scale_colour_brewer(palette = "Set1",
                        limits = c("NL", "AL"),
                        guide = "none")+
    theme_bw() +
    theme(panel.grid.major.y = element_blank()) +
    facet_grid(lg ~ ., scales = "free_y", space = "free_y")
Shaded area plot
sunspotyear <- data.frame(Year = as.numeric(time(sunspot.year)),
                          Sunspots = as.numeric(sunspot.year))

ggplot(sunspotyear, aes(x = Year, y = Sunspots)) +geom_area()
ggplot(sunspotyear, aes(x = Year, y = Sunspots)) +
    geom_area(colour = "black", fill = "blue", alpha = .2)
Making stakend area graph
ggplot(uspopage, aes(x = Year, y = Thousands, fill = AgeGroup)) +
    geom_area()
ggplot(uspopage, aes(x = Year, y = Thousands, fill = AgeGroup)) +
    geom_area(colour = "black", size = .2, alpha = .4) +
scale_fill_brewer(palette = "Blues") 
ggplot(uspopage, aes(x = Year, y = Thousands, fill = AgeGroup,
                     order = dplyr::desc(AgeGroup))) +
    geom_area(colour = NA, alpha = .4) +
    scale_fill_brewer(palette = "Blues") +
geom_line(position = "stack", size = .2) 
Making proportional stakend area graph
ggplot(uspopage, aes(x = Year, y = Thousands, fill = AgeGroup)) +
    geom_area(position = "fill",
              colour = "black",
              size = .2,
              alpha = .4) +
    scale_fill_brewer(palette = "Blues")
ggplot(uspopage, aes(x = Year, y = Thousands, fill = AgeGroup)) +
    geom_area(position = "fill",
              colour = "black",
              size = .2,
              alpha = .4) +
    scale_fill_brewer(palette = "Blues") +
scale_y_continuous(labels = scales::percent) 
Scatter plot
ggplot(heightweight, aes(x = ageYear, y = heightIn)) +
    geom_point()
ggplot(heightweight, aes(x = ageYear, y = heightIn)) +
    geom_point(shape = 21, size = 4)
Custumize point shapes
heightweight %>%
    dplyr::select(sex, ageYear, heightIn)
## sex ageYear heightIn
## 1 f 11.92 56.3
## 2 f 12.92 62.3
## 3 f 12.75 63.3
## 4 f 13.42 59.0
## 5 f 15.92 62.5
## 6 f 14.25 62.5
## 7 f 15.42 59.0
## 8 f 11.83 56.5
## 9 f 13.33 62.0
## 10 f 11.67 53.8
## 11 f 11.58 61.5
## 12 f 14.83 61.5
## 13 f 13.08 64.5
## 14 f 12.42 58.3
## 15 f 11.92 51.3
## 16 f 12.08 58.8
## 17 f 15.92 65.3
## 18 f 12.50 59.5
## 19 f 12.25 61.3
## 20 f 15.00 63.3
## 21 f 11.75 61.8
## 22 f 11.67 53.5
## 23 f 13.67 58.0
## 24 f 14.67 61.3
## 25 f 15.42 63.3
## 26 f 13.83 61.5
## 27 f 14.58 60.8
## 28 f 15.00 59.0
## 29 f 17.50 65.5
## 30 f 12.17 56.3
## 31 f 14.17 64.3
## 32 f 13.50 58.0
## 33 f 12.42 64.3
## 34 f 11.58 57.5
## 35 f 15.50 57.8
## 36 f 16.42 61.5
## 37 f 14.08 62.3
## 38 f 14.75 61.8
## 39 f 15.42 65.3
## 40 f 15.17 58.3
## 41 f 14.42 62.8
## 42 f 13.83 59.3
## 43 f 14.00 61.5
## 44 f 14.08 62.0
## 45 f 12.50 61.3
## 46 f 15.33 62.3
## 47 f 11.58 52.8
## 48 f 12.25 59.8
## 49 f 12.00 59.5
## 50 f 14.75 61.3
## 51 f 14.83 63.5
## 52 f 16.42 64.8
## 53 f 12.17 60.0
## 54 f 12.08 59.0
## 55 f 12.25 55.8
## 56 f 12.08 57.8
## 57 f 12.92 61.3
## 58 f 13.92 62.3
## 59 f 15.25 64.3
## 60 f 11.92 55.5
## 61 f 15.25 64.5
## 62 f 15.42 60.0
## 63 f 12.33 56.3
## 64 f 12.25 58.3
## 65 f 12.83 60.0
## 66 f 13.00 54.5
## 67 f 12.00 55.8
## 68 f 12.83 62.8
## 69 f 12.67 60.5
## 70 f 15.92 63.3
## 71 f 15.83 66.8
## 72 f 11.67 60.0
## 73 f 12.33 60.5
## 74 f 15.75 64.3
## 75 f 11.92 58.3
## 76 f 14.83 66.5
## 77 f 13.67 65.3
## 78 f 13.08 60.5
## 79 f 12.25 59.5
## 80 f 12.33 59.0
## 81 f 14.75 61.3
## 82 f 14.25 61.5
## 83 f 14.33 64.8
## 84 f 15.83 56.8
## 85 f 15.25 66.5
## 86 f 11.92 61.5
## 87 f 14.92 63.0
## 88 f 15.50 57.0
## 89 f 15.17 65.5
## 90 f 15.17 62.0
## 91 f 11.83 56.0
## 92 f 13.75 61.3
## 93 f 13.75 55.5
## 94 f 12.83 61.0
## 95 f 12.50 54.5
## 96 f 12.92 66.0
## 97 f 13.58 56.5
## 98 f 11.75 56.0
## 99 f 12.25 51.5
## 100 f 17.50 62.0
## 101 f 14.25 63.0
## 102 f 13.92 61.0
## 103 f 15.17 64.0
## 104 f 12.00 61.0
## 105 f 16.08 59.8
## 106 f 11.75 61.3
## 107 f 13.67 63.3
## 108 f 15.50 63.5
## 109 f 14.08 61.5
## 110 f 14.58 60.3
## 111 f 15.00 61.3
## 112 m 13.75 64.8
## 113 m 13.08 60.5
## 114 m 12.00 57.3
## 115 m 12.50 59.5
## 116 m 12.50 60.8
## 117 m 11.58 60.5
## 118 m 15.75 67.0
## 119 m 15.25 64.8
## 120 m 12.25 50.5
## 121 m 12.17 57.5
## 122 m 13.33 60.5
## 123 m 13.00 61.8
## 124 m 14.42 61.3
## 125 m 12.58 66.3
## 126 m 11.75 53.3
## 127 m 12.50 59.0
## 128 m 13.67 57.8
## 129 m 12.75 60.0
## 130 m 17.17 68.3
## 132 m 14.67 63.8
## 133 m 14.67 65.0
## 134 m 11.67 59.5
## 135 m 15.42 66.0
## 136 m 15.00 61.8
## 137 m 12.17 57.3
## 138 m 15.25 66.0
## 139 m 11.67 56.5
## 140 m 12.58 58.3
## 141 m 12.58 61.0
## 142 m 12.00 62.8
## 143 m 13.33 59.3
## 144 m 14.83 67.3
## 145 m 16.08 66.3
## 146 m 13.50 64.5
## 147 m 13.67 60.5
## 148 m 15.50 66.0
## 149 m 11.92 57.5
## 150 m 14.58 64.0
## 151 m 14.58 68.0
## 152 m 14.58 63.5
## 153 m 14.42 69.0
## 154 m 14.17 63.8
## 155 m 14.50 66.0
## 156 m 13.67 63.5
## 157 m 12.00 59.5
## 158 m 13.00 66.3
## 159 m 12.42 57.0
## 160 m 12.00 60.0
## 161 m 12.25 57.0
## 162 m 15.67 67.3
## 163 m 14.08 62.0
## 164 m 14.33 65.0
## 165 m 12.50 59.5
## 166 m 16.08 67.8
## 167 m 13.08 58.0
## 168 m 14.00 60.0
## 169 m 11.67 58.5
## 170 m 13.00 58.3
## 171 m 13.00 61.5
## 172 m 13.17 65.0
## 173 m 15.33 66.5
## 174 m 13.00 68.5
## 175 m 12.00 57.0
## 176 m 14.67 61.5
## 177 m 14.00 66.5
## 178 m 12.42 52.5
## 179 m 11.83 55.0
## 180 m 15.67 71.0
## 181 m 16.92 66.5
## 182 m 11.83 58.8
## 183 m 15.75 66.3
## 184 m 15.67 65.8
## 185 m 16.67 71.0
## 186 m 12.67 59.5
## 187 m 14.50 69.8
## 188 m 13.83 62.5
## 189 m 12.08 56.5
## 190 m 11.92 57.5
## 191 m 13.58 65.3
## 192 m 13.83 67.3
## 193 m 15.17 67.0
## 194 m 14.42 66.0
## 195 m 12.92 61.8
## 196 m 13.50 60.0
## 197 m 14.75 63.0
## 198 m 14.75 60.5
## 199 m 14.58 65.5
## 200 m 13.83 62.0
## 201 m 12.50 59.0
## 202 m 12.50 61.8
## 203 m 15.67 63.3
## 204 m 13.58 66.0
## 205 m 14.25 61.8
## 206 m 13.50 63.0
## 207 m 11.75 57.5
## 208 m 14.50 63.0
## 209 m 11.83 56.0
## 210 m 12.33 60.5
## 211 m 11.67 56.8
## 212 m 13.33 64.0
## 213 m 12.00 60.0
## 214 m 17.17 69.5
## 215 m 13.25 63.3
## 216 m 12.42 56.3
## 217 m 16.08 72.0
## 218 m 16.17 65.3
## 219 m 12.67 60.8
## 220 m 12.17 55.0
## 221 m 11.58 55.0
## 222 m 15.50 66.5
## 223 m 13.42 56.8
## 224 m 12.75 64.8
## 225 m 16.33 64.5
## 226 m 13.67 58.0
## 227 m 13.25 62.8
## 228 m 14.83 63.8
## 229 m 12.75 57.8
## 230 m 12.92 57.3
## 231 m 14.83 63.5
## 232 m 11.83 55.0
## 233 m 13.67 66.5
## 234 m 15.75 65.0
## 235 m 13.67 61.5
## 236 m 13.92 62.0
## 237 m 12.58 59.3ggplot(heightweight, aes(ageYear,heightIn, shape= sex, color = sex))+
geom_point()
ggplot(heightweight, aes(x = ageYear,
                         y = heightIn,
                         shape = sex,
                         colour = sex)) +
    geom_point() +
    scale_shape_manual(values = c(21,22)) +
    scale_colour_brewer(palette = "Set1")
Histogramas
#with Rbase
hist(mtcars$mpg)
ggplot(faithful, aes(x = waiting)) +
    geom_histogram()
w <- faithful$waiting

ggplot(NULL, aes(x = w)) + #with ggplot2
    geom_histogram()
ggplot(faithful, aes(x = waiting)) +
    geom_histogram(binwidth = 5,
                   fill = "white",
                   colour = "black")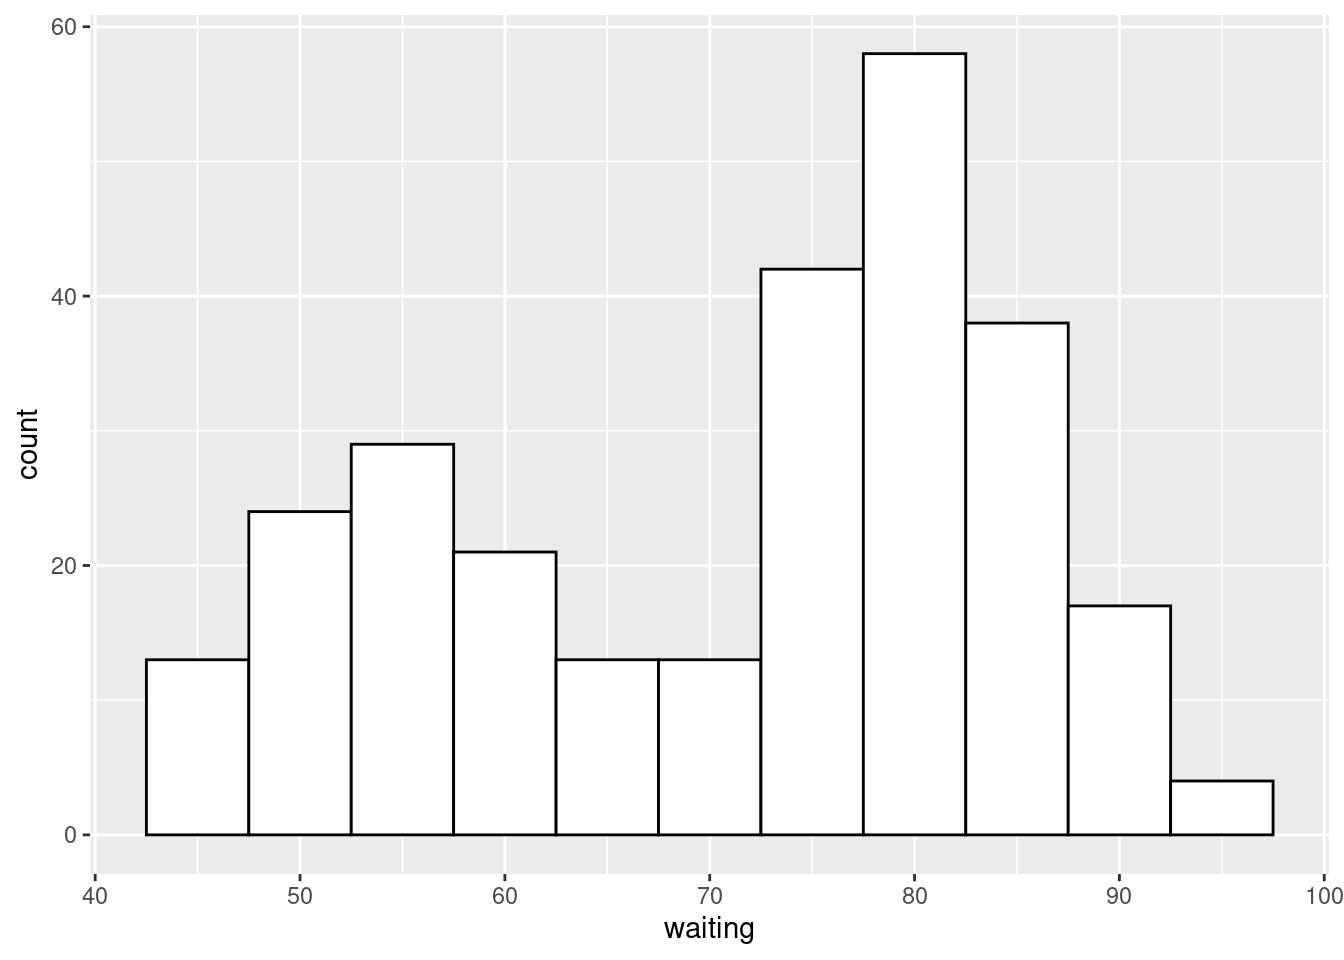
binsize <- diff(range(faithful$waiting))/15
ggplot(faithful, aes(x = waiting)) +
    geom_histogram(binwidth = binsize, fill = "white", colour = "black")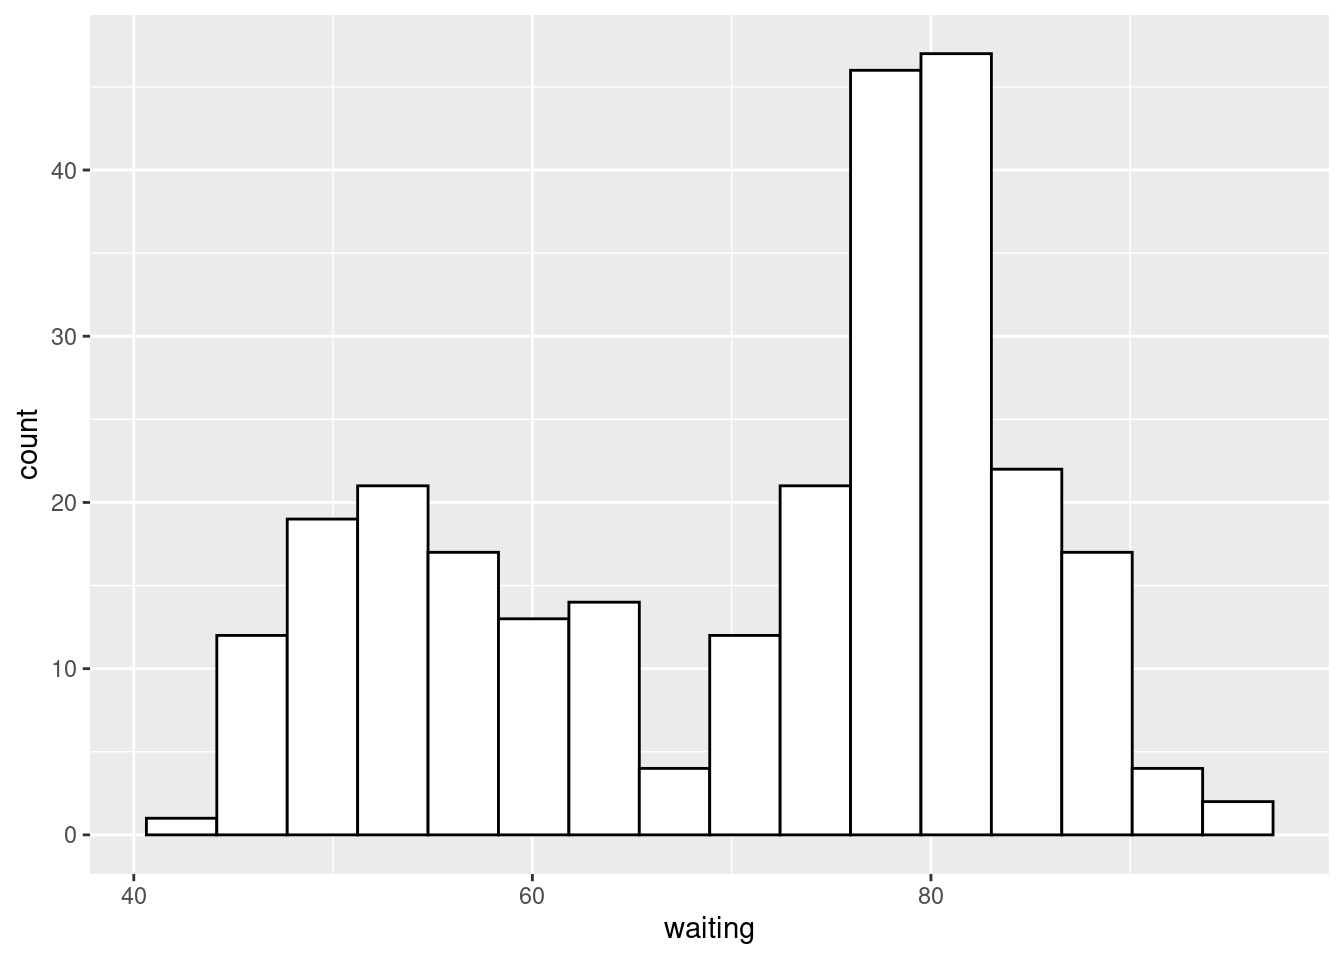
Faceting histograms
library(MASS) # Load MASS for the birthwt data set
# Use smoke as the faceting variable
ggplot(birthwt, aes(x = bwt)) +
    geom_histogram(fill = "white", colour = "black") +
    facet_grid(smoke ~ .)
birthwt_mod <- birthwt
# Convert smoke to a factor and reassign new names
birthwt_mod$smoke <- recode_factor(birthwt_mod$smoke,
                                   '0' = 'No Smoke',
                                   '1' = 'Smoke')

ggplot(birthwt_mod, aes(x = bwt)) +
    geom_histogram(fill = "white", colour = "black") +
    facet_grid(smoke ~ .)
ggplot(birthwt, aes(x = bwt)) +
    geom_histogram(fill = "white", colour = "black") +
    facet_grid(race ~ .)
ggplot(birthwt, aes(x = bwt)) +
    geom_histogram(fill = "white", colour = "black") +
    facet_grid(race ~ ., scales = "free")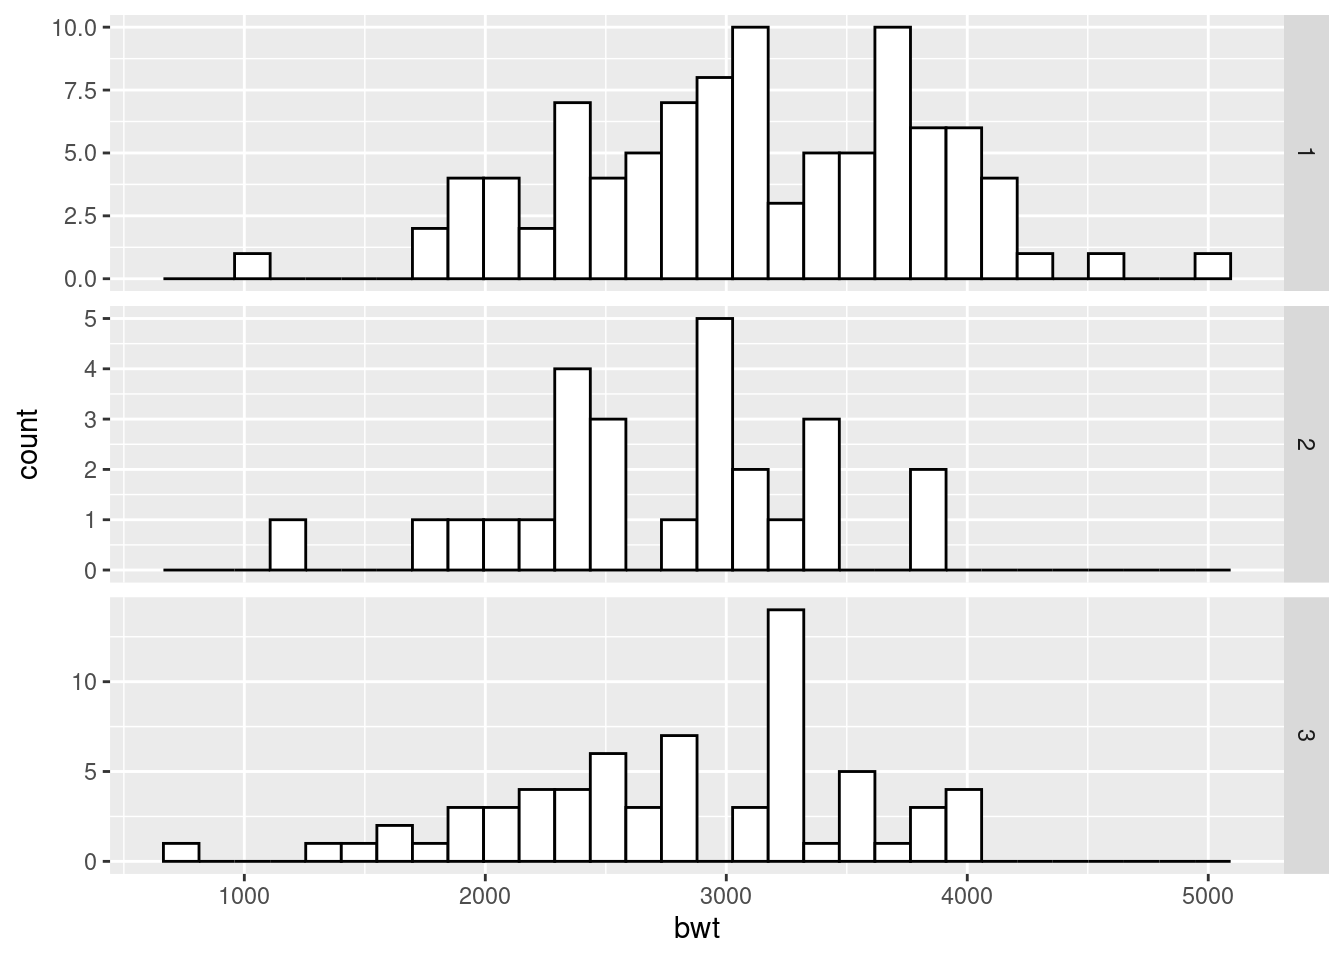
#--- Histogramas solapadas

ggplot(birthwt_mod, aes(x = bwt, fill = smoke)) +
    geom_histogram(position = "identity", alpha = 0.4)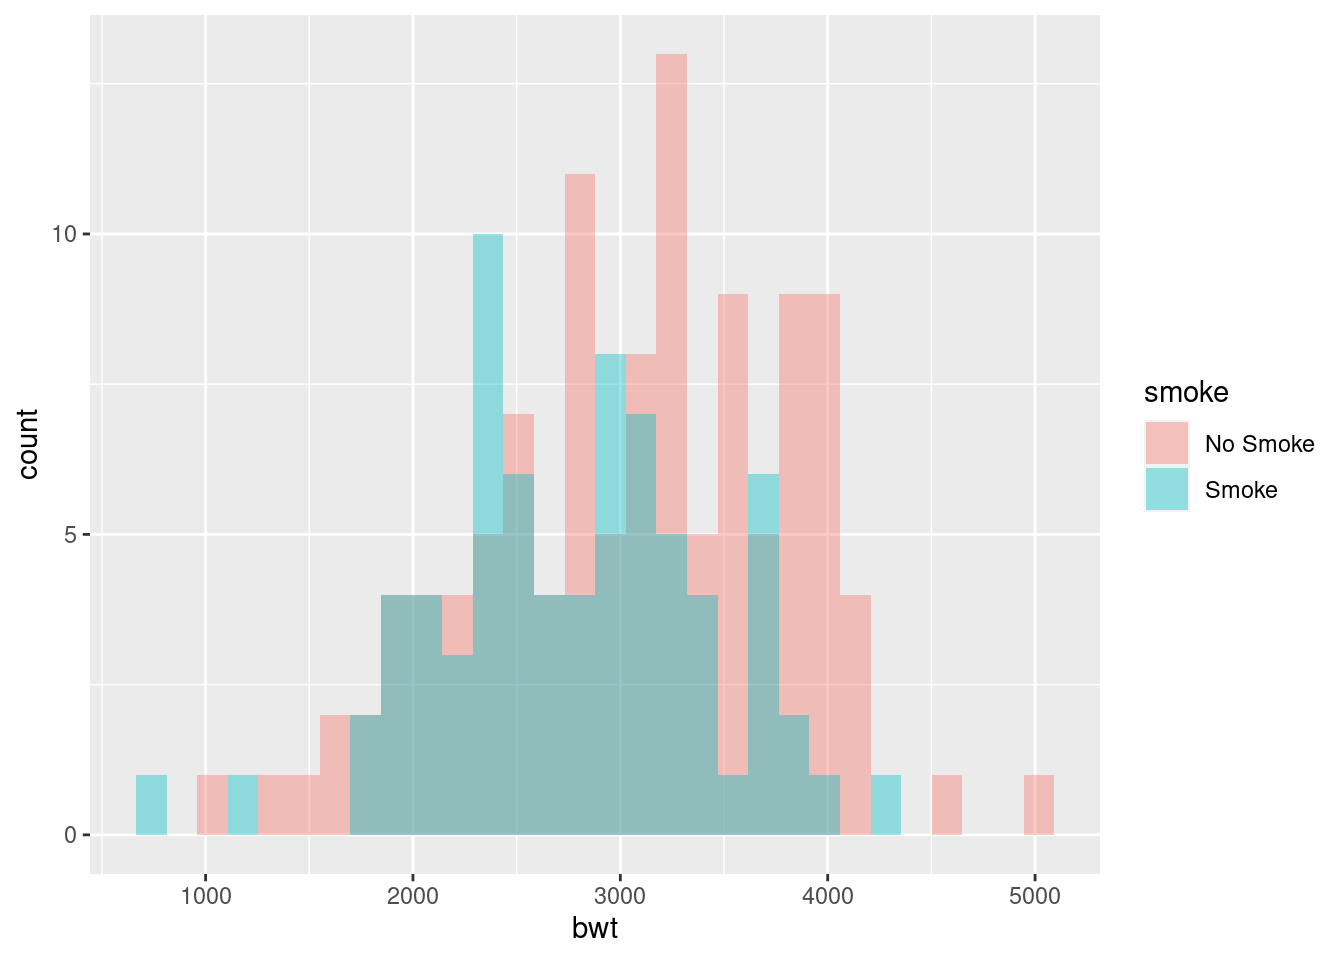
Density curve
ggplot(faithful, aes(x = waiting)) +
geom_density()
ggplot(faithful, aes(x = waiting)) +
    geom_line(stat = "density")+
    expand_limits(y = 0)
# Store the values in a simple vector
w <- faithful$waiting

ggplot(NULL, aes(x = w)) +
    geom_density()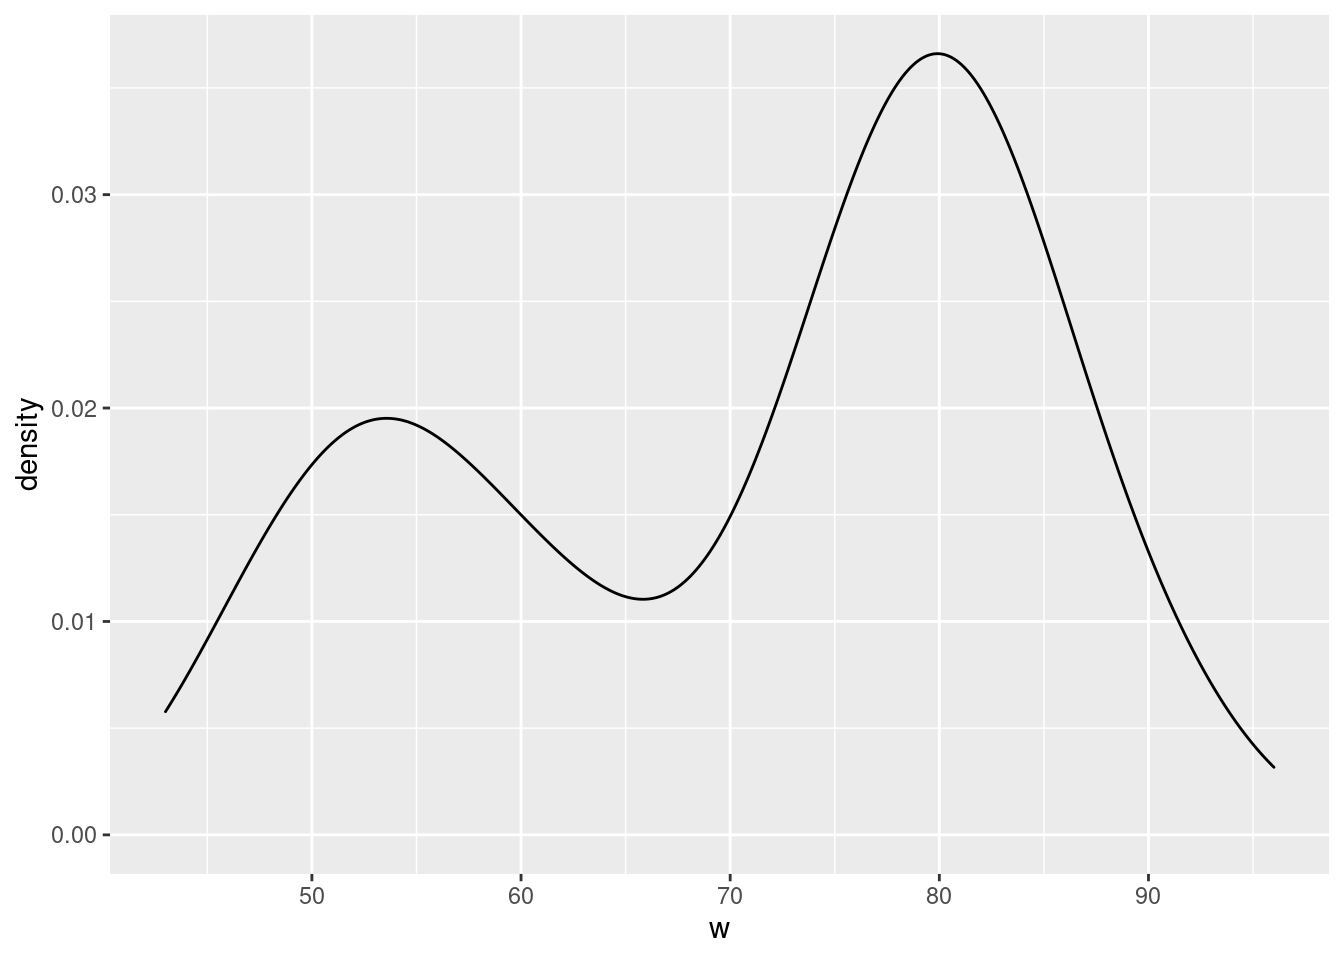
ggplot(faithful, aes(x = waiting, y = ..density..)) +
    geom_histogram(fill = "cornsilk", colour = "grey60", size = .2) +
    geom_density() +
    xlim(35, 105)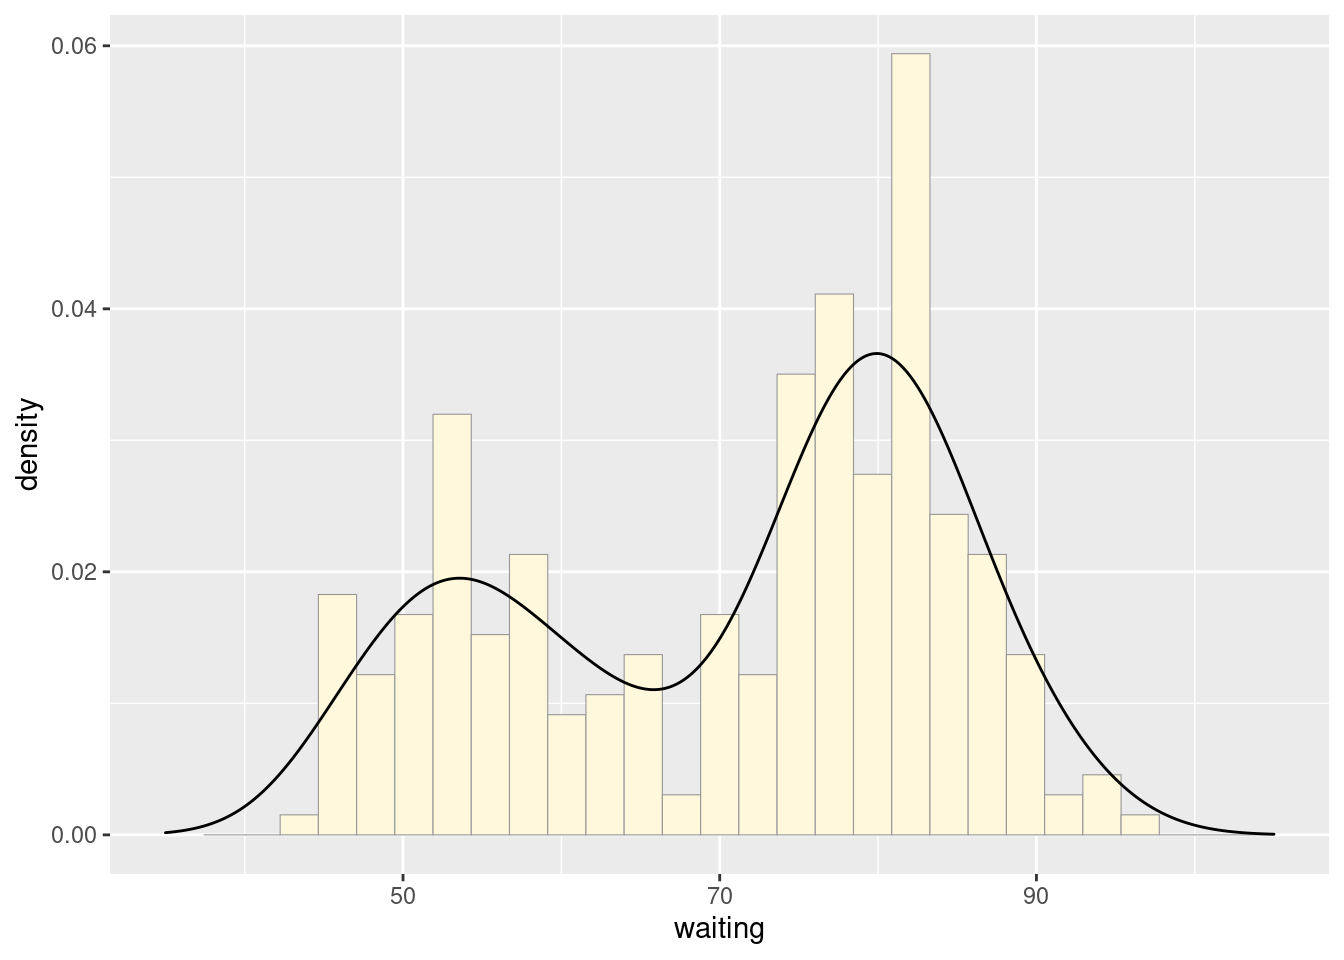
Multiple density curve
library(MASS) # Load MASS for the birthwt data set

birthwt_mod <- birthwt %>%
    mutate(smoke = as.factor(smoke)) # Convert smoke to a factor
# Map smoke to colour
ggplot(birthwt_mod, aes(x = bwt, colour = smoke)) +
    geom_density()
# Map smoke to fill and make the fill semitransparent by setting alpha
ggplot(birthwt_mod, aes(x = bwt, fill = smoke)) +
    geom_density(alpha = .3)
birthwt_mod$smoke <- recode(birthwt_mod$smoke,
                            '0' = 'No Smoke',
                            '1' = 'Smoke')

ggplot(birthwt_mod, aes(x = bwt, y = ..density..)) +
    geom_histogram(binwidth = 200,
                   fill = "cornsilk",
                   colour = "grey60",
                   size = .2) +
    geom_density() +
    facet_grid(smoke ~ .)
Dot-plots
heightweight %>% head## sex ageYear ageMonth heightIn weightLb
## 1 f 11.92 143 56.3 85.0
## 2 f 12.92 155 62.3 105.0
## 3 f 12.75 153 63.3 108.0
## 4 f 13.42 161 59.0 92.0
## 5 f 15.92 191 62.5 112.5
## 6 f 14.25 171 62.5 112.0ggplot(heightweight, aes(x = sex, y = heightIn)) +
geom_dotplot(binaxis = "y", binwidth = .5, stackdir = "center")
ggplot(heightweight, aes(x = sex, y = heightIn)) + #solapar sobre boxplot
    geom_boxplot(outlier.colour = NA, width = .4) +
    geom_dotplot(binaxis = "y",
                 binwidth = .5,
                 stackdir = "center",
                 fill = NA)
Density-plot 2D
faithful_p <- ggplot(faithful, aes(x = eruptions, y = waiting))

faithful_p +
    geom_point() +
    stat_density2d()# density plot 2D
faithful_p +
stat_density2d(aes(colour = ..level..))# 
faithful_p +
        stat_density2d(aes(fill = ..density..),
               geom = "raster",
               contour = FALSE)
faithful_p +
    geom_point() +
    stat_density2d(aes(alpha = ..density..),
                   geom = "tile",
                   contour = FALSE)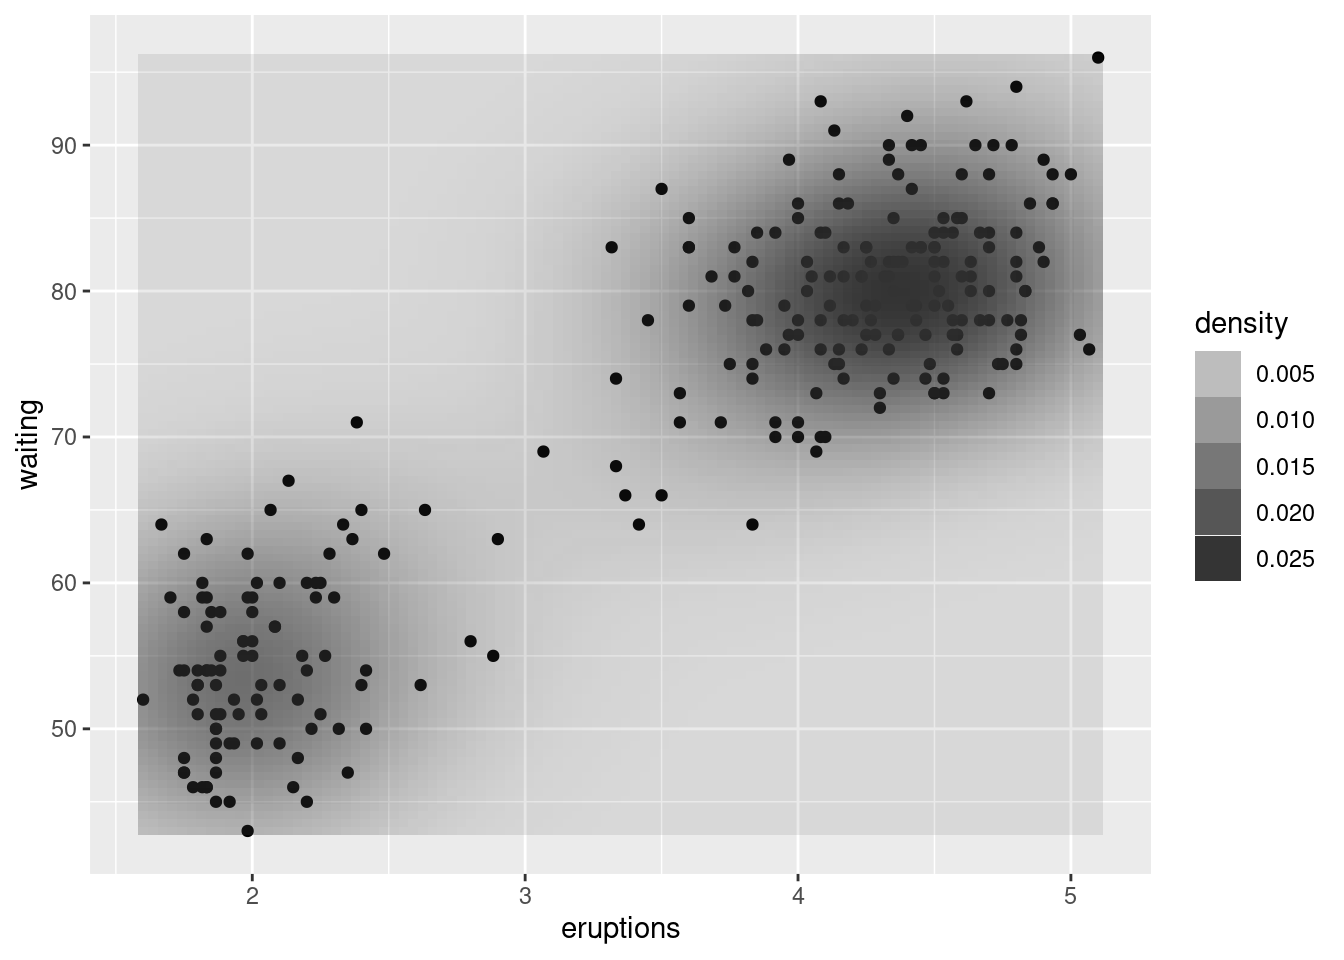
faithful_p +
    stat_density_2d(
        aes(fill = ..density..),
        geom = "raster",
        contour = F,
        h = c(.5, 5))
Annotations
Añadir texto o formulas
p <- ggplot(faithful, aes(x = eruptions, y = waiting)) +
    geom_point()

p +
    annotate(geom =  "text", x = 3, y = 48, label = "Group 1") +
    annotate(geom = "text", x = 4.5, y = 66, label = "Group 2")
p +
    annotate("text",
             x = 3,
             y = 48,
             label = "Group 1",
             family = "serif",
             fontface = "italic",
             colour = "darkred",
             size =3) +
    annotate("text",
             x = 4.5,
             y = 66,
             label = "Group 2",
             family = "serif",
             fontface = "italic",
             colour = "darkred",
             size = 3)
p +
    annotate("text",
             x = -Inf,
             y = Inf,
             label = "Upper left",
             hjust = -.2,
             vjust = 2) +
    annotate("text",
             x = mean(range(faithful$eruptions)),
             y = -Inf, vjust =-0.4,
             label = "Bottom middle")
p <- ggplot(data.frame(x = c(-3,3)), aes(x = x)) +
    stat_function(fun = dnorm)

p +
    annotate("text", x = 2, y = 0.3, parse = TRUE,
label = "frac(1, sqrt(2 * pi)) * e ^ {-x^2 / 2}") #matemathical expressions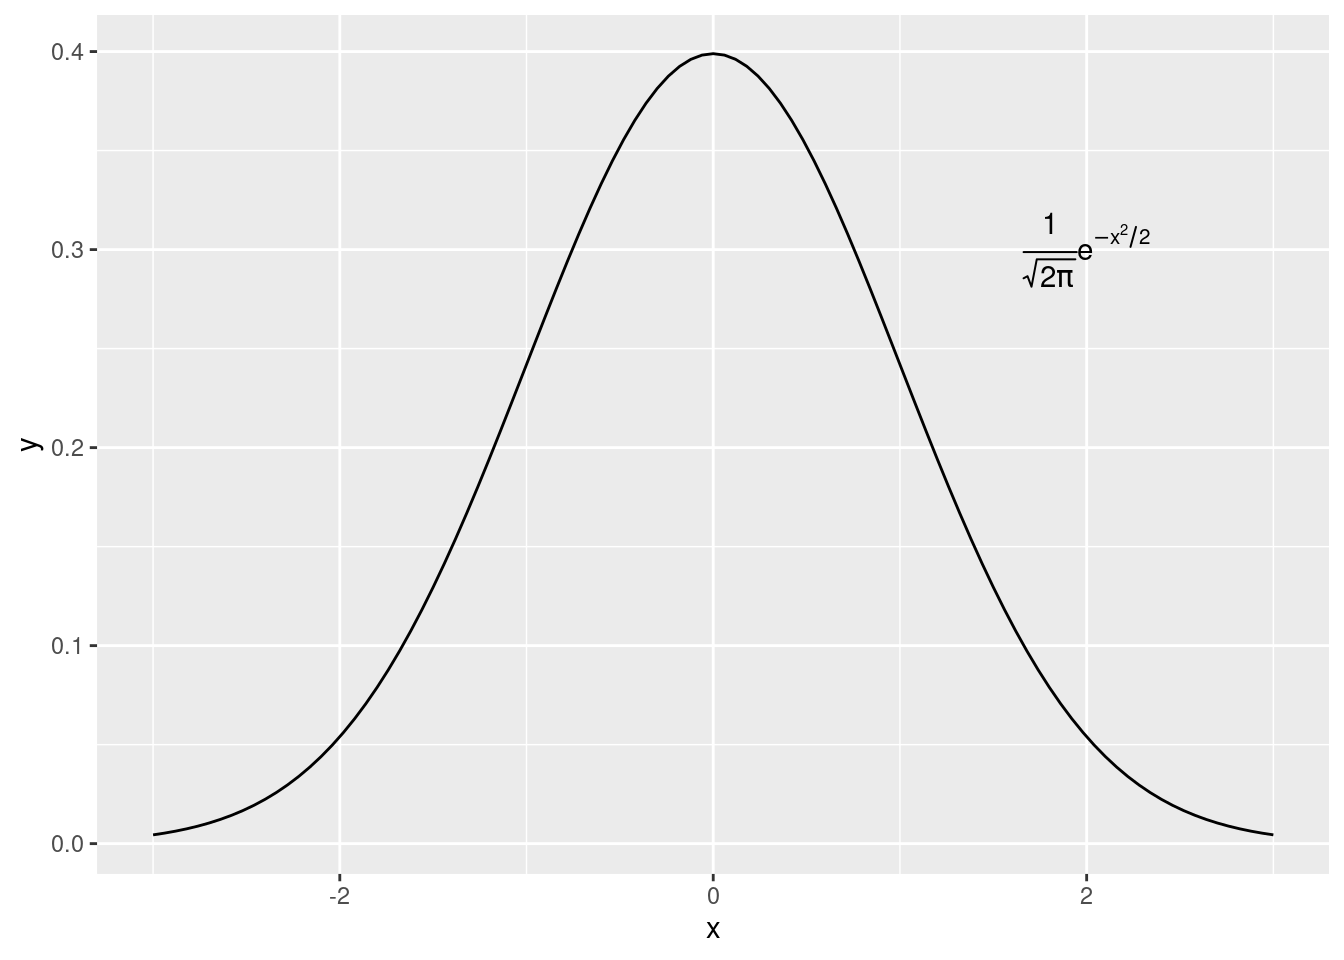
Adding lines
hw_plot <- ggplot(heightweight,
                  aes(x = ageYear,
                      y = heightIn,
                      colour = sex))+
    geom_point()

# Add horizontal and vertical lines
hw_plot +
    geom_hline(yintercept = 60) +
    geom_vline(xintercept = 14)
# Add angled line
hw_plot +
    geom_abline(intercept = 37.4, slope = 1.75)
hw_means <- heightweight %>%
    group_by(sex) %>%
    summarise(heightIn = mean(heightIn))

hw_plot +
    geom_hline(data = hw_means,
               aes(yintercept = heightIn, colour = sex),
               linetype = "dashed",
               size = 0.5)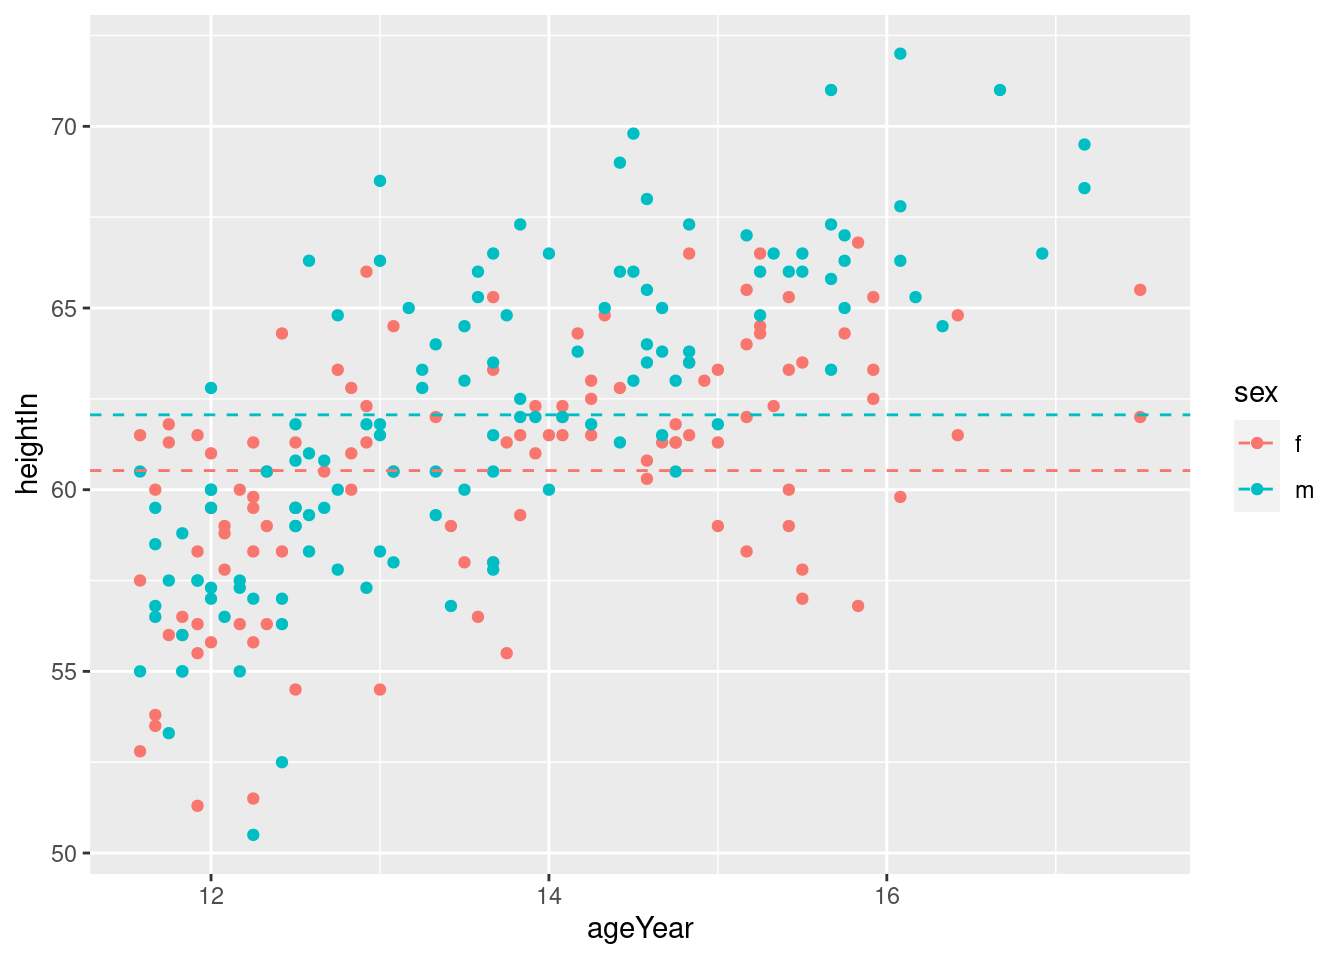
Adding line Segments and Arrows
p <- ggplot(filter(climate, Source == "Berkeley"),
            aes(x = Year, y = Anomaly10y)) +
    geom_line()

p +
    annotate(geom = "segment",
             x = 1950,
             xend = 1980,
             y = -.25,
             yend = -.25)
p +
    annotate("segment",
             x = 1850,
             xend = 1820,
             y = -.8,
             yend = -.95,
             colour = "red",
             size = 1,
             arrow = arrow(type = "closed",
                           length = unit(.2,"cm"),
                           ends = "last")) +
    annotate("segment",
             x = 1950,
             xend = 1980,
             y = -.25,
             yend = -.25,
             arrow = arrow(ends = "both",
                           angle = 90,
                           length = unit(.2,"cm"),))
Adding rectangles
p <- ggplot(filter(climate, Source == "Berkeley"),
            aes(x = Year, y = Anomaly10y)) +
    geom_line()

p +
    annotate(geom =  "rect",
             xmin = 1950,
             xmax = 1980,
             ymin = -1,
             ymax = 1,
             alpha = .1,
             fill = "blue")
Highlight an item
library(dplyr)
pg_mod <- PlantGrowth %>%
    mutate(hl = recode(group,
                       "ctrl" = "no",
                       "trt1" = "no",
                       "trt2" = "yes"))
pg_mod
## weight group hl
## 1 4.17 ctrl no
## 2 5.58 ctrl no
## 3 5.18 ctrl no
## 4 6.11 ctrl no
## 5 4.50 ctrl no
## 6 4.61 ctrl no
## 7 5.17 ctrl no
## 8 4.53 ctrl no
## 9 5.33 ctrl no
## 10 5.14 ctrl no
## 11 4.81 trt1 no
## 12 4.17 trt1 no
## 13 4.41 trt1 no
## 14 3.59 trt1 no
## 15 5.87 trt1 no
## 16 3.83 trt1 no
## 17 6.03 trt1 no
## 18 4.89 trt1 no
## 19 4.32 trt1 no
## 20 4.69 trt1 no
## 21 6.31 trt2 yes
## 22 5.12 trt2 yes
## 23 5.54 trt2 yes
## 24 5.50 trt2 yes
## 25 5.37 trt2 yes
## 26 5.29 trt2 yes
## 27 4.92 trt2 yes
## 28 6.15 trt2 yes
## 29 5.80 trt2 yes
## 30 5.26 trt2 yesggplot(pg_mod, aes(x = group, y = weight, fill = hl)) +
geom_boxplot() +
scale_fill_manual(values = c("grey85", "#FFDDCC"),
guide = F)
Adding text
mpg_plot <- ggplot(mpg, aes(x = displ, y = hwy)) +
    geom_point() +
    facet_grid(. ~ drv)

# A data frame with labels for each facet
f_labels <- data.frame(drv = c("4", "f", "r"), label = c("4wd",
                                                         "Front",
                                                         "Rear"))

mpg_plot +
    geom_text(x = 6,
              y = 40,
              aes(label = label),
              data = f_labels)
Axes
coord_flip
ggplot(PlantGrowth, aes(x = group, y = weight)) +
    geom_boxplot()
ggplot(PlantGrowth, aes(x = group, y = weight)) +
    geom_boxplot() +
    coord_flip()
ggplot(PlantGrowth, aes(x = group, y = weight)) +
    geom_boxplot() +
    coord_flip() +
    scale_x_discrete(limits = rev(levels(PlantGrowth$group)))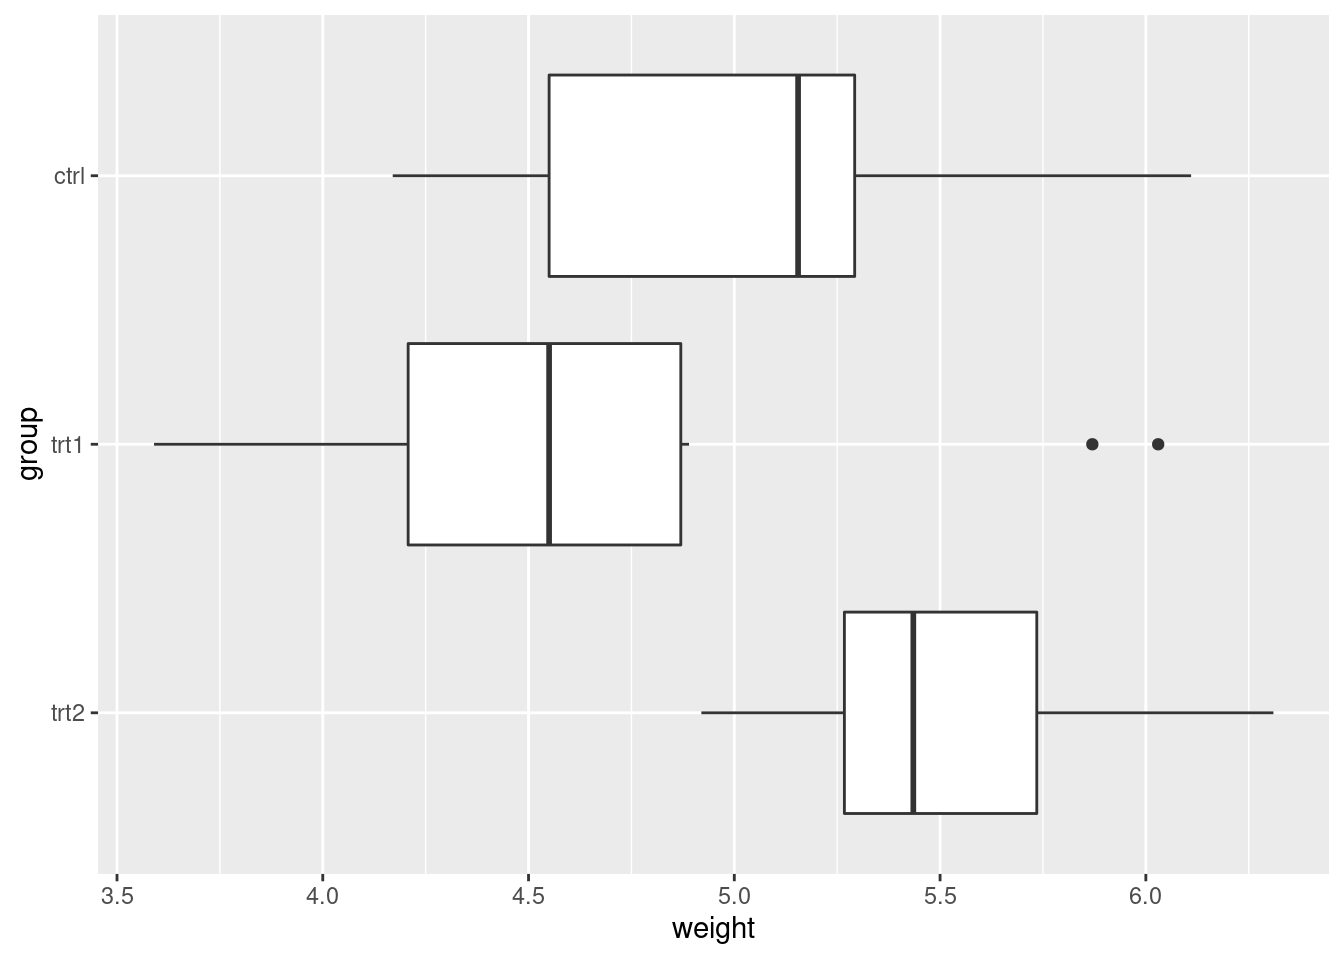
Setting the Range of a Continuous Axis
pg_plot <- ggplot(PlantGrowth,
                  aes(x = group, y = weight)) +
    geom_boxplot()
# Display the basic graph
pg_plot
pg_plot +
    ylim(0, max(PlantGrowth$weight))
pg_plot +
scale_y_continuous(limits = c(5, 6.5)) 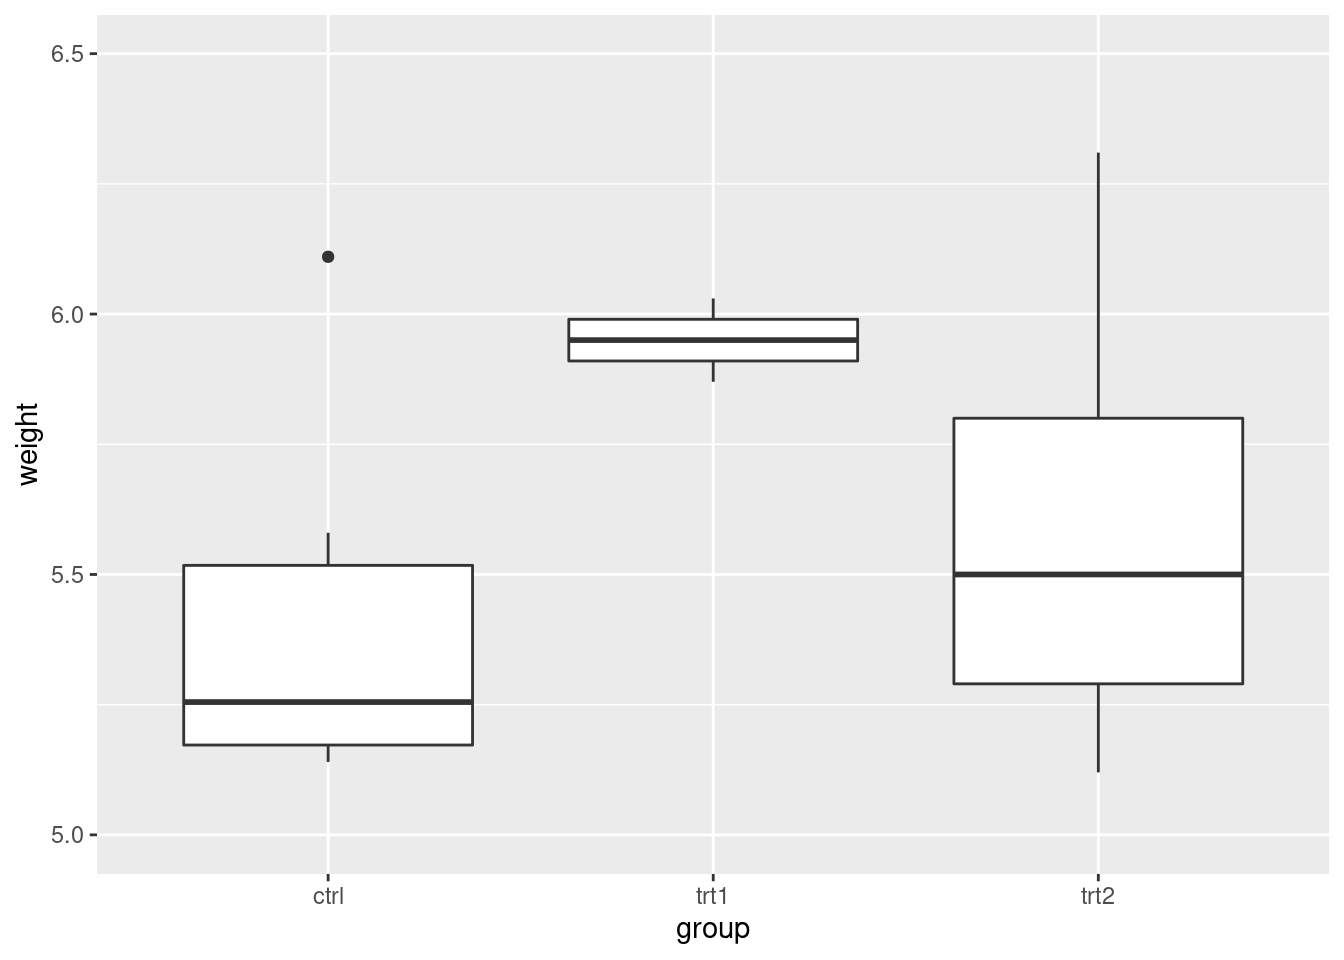
pg_plot +
coord_cartesian(ylim = c(5, 6.5)) 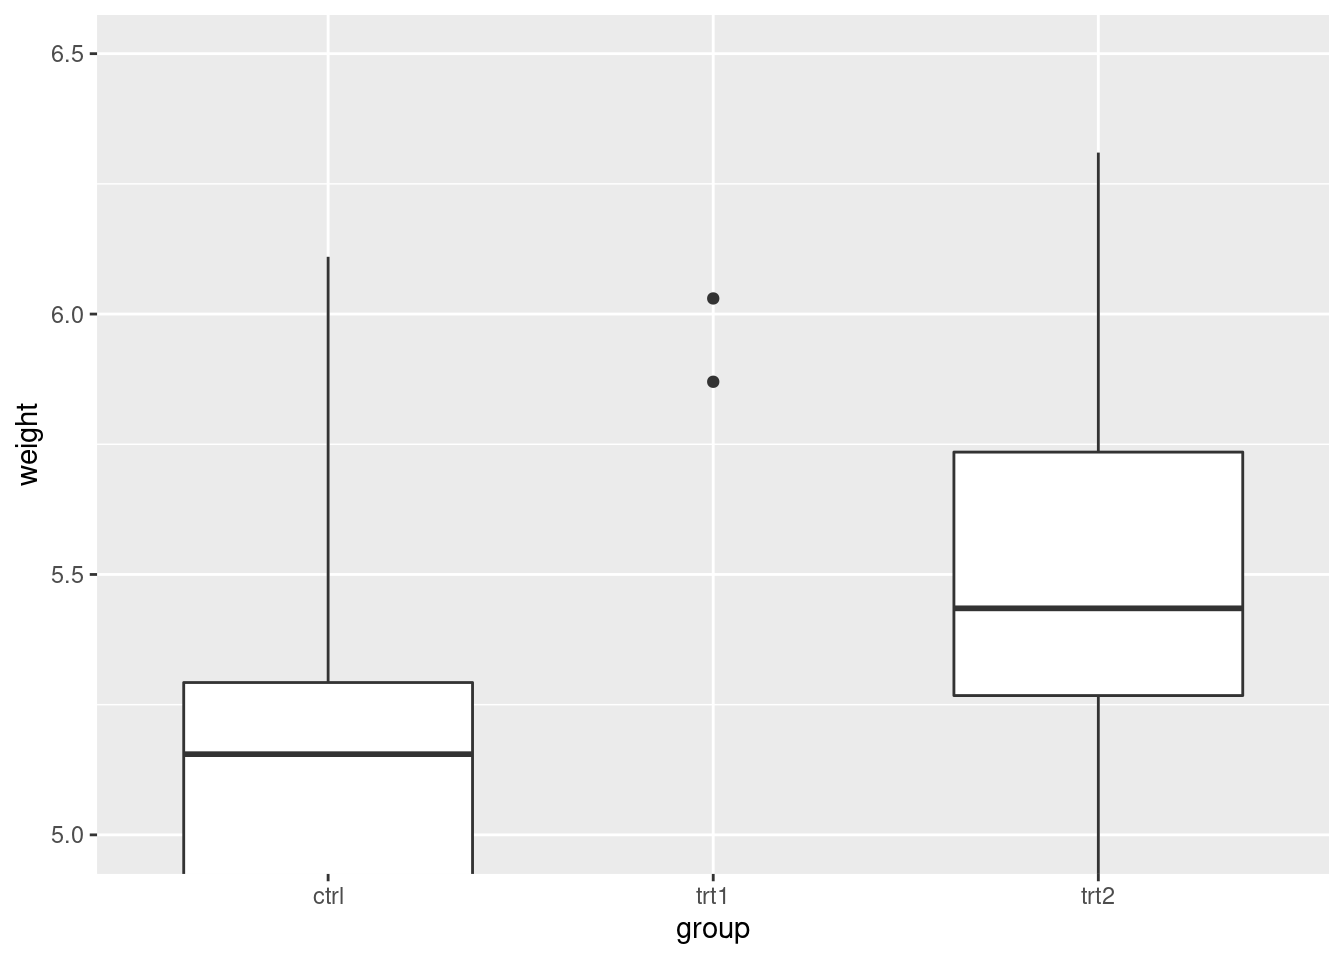
pg_plot +
expand_limits(y = 0) 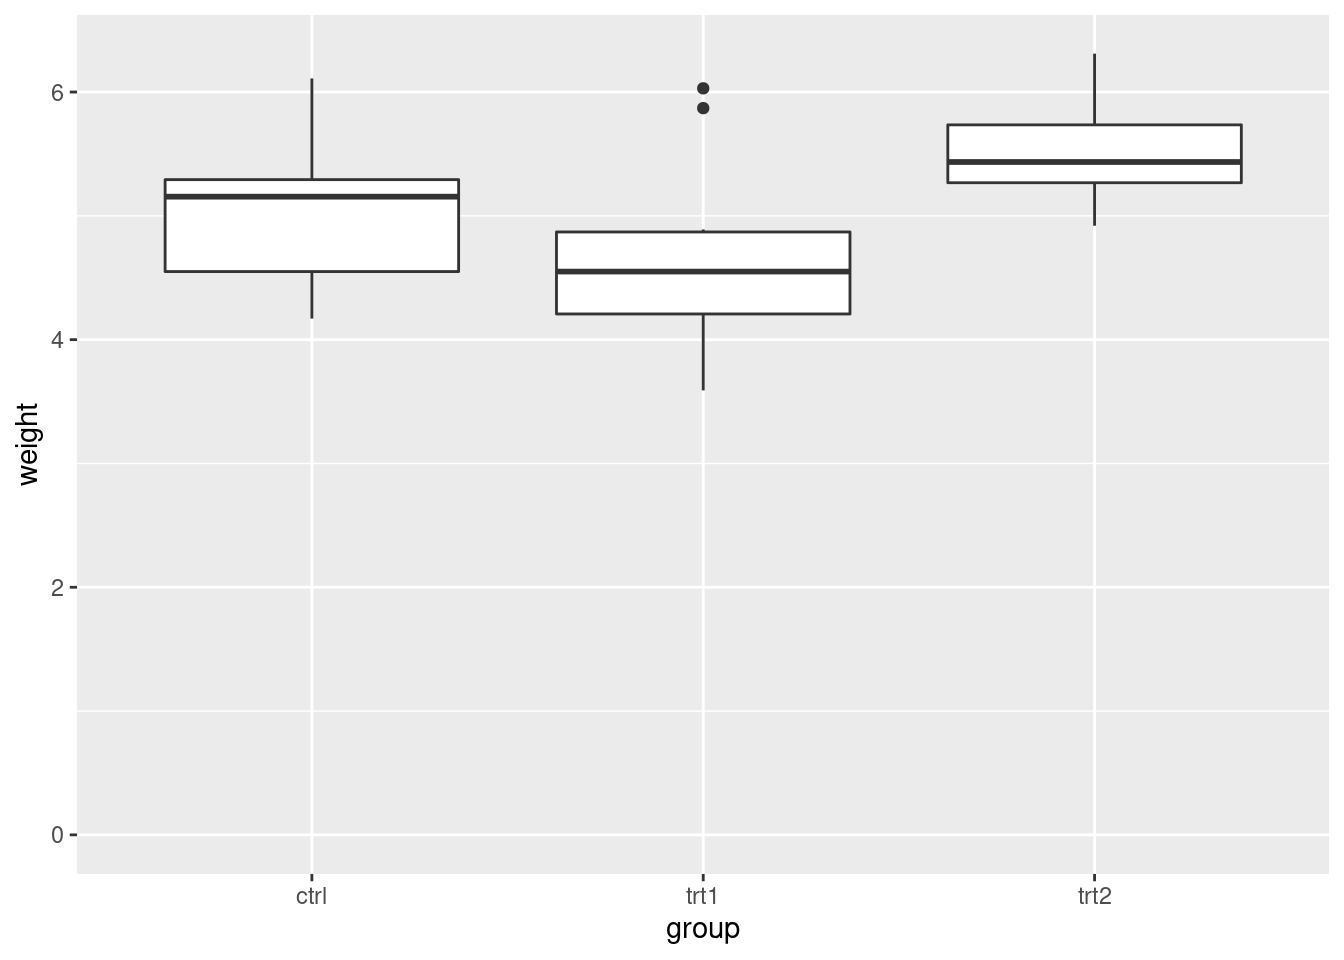
Rearrange elements
pg_plot <- ggplot(PlantGrowth, aes(x = group, y = weight)) +
    geom_boxplot()

pg_plot +
    scale_x_discrete(limits = c("trt1", "ctrl", "trt2"))
pg_plot +
    scale_x_discrete(limits = c( "ctrl","trt1", "trt2"))
pg_plot +
scale_x_discrete(limits = c("ctrl", "trt1")) 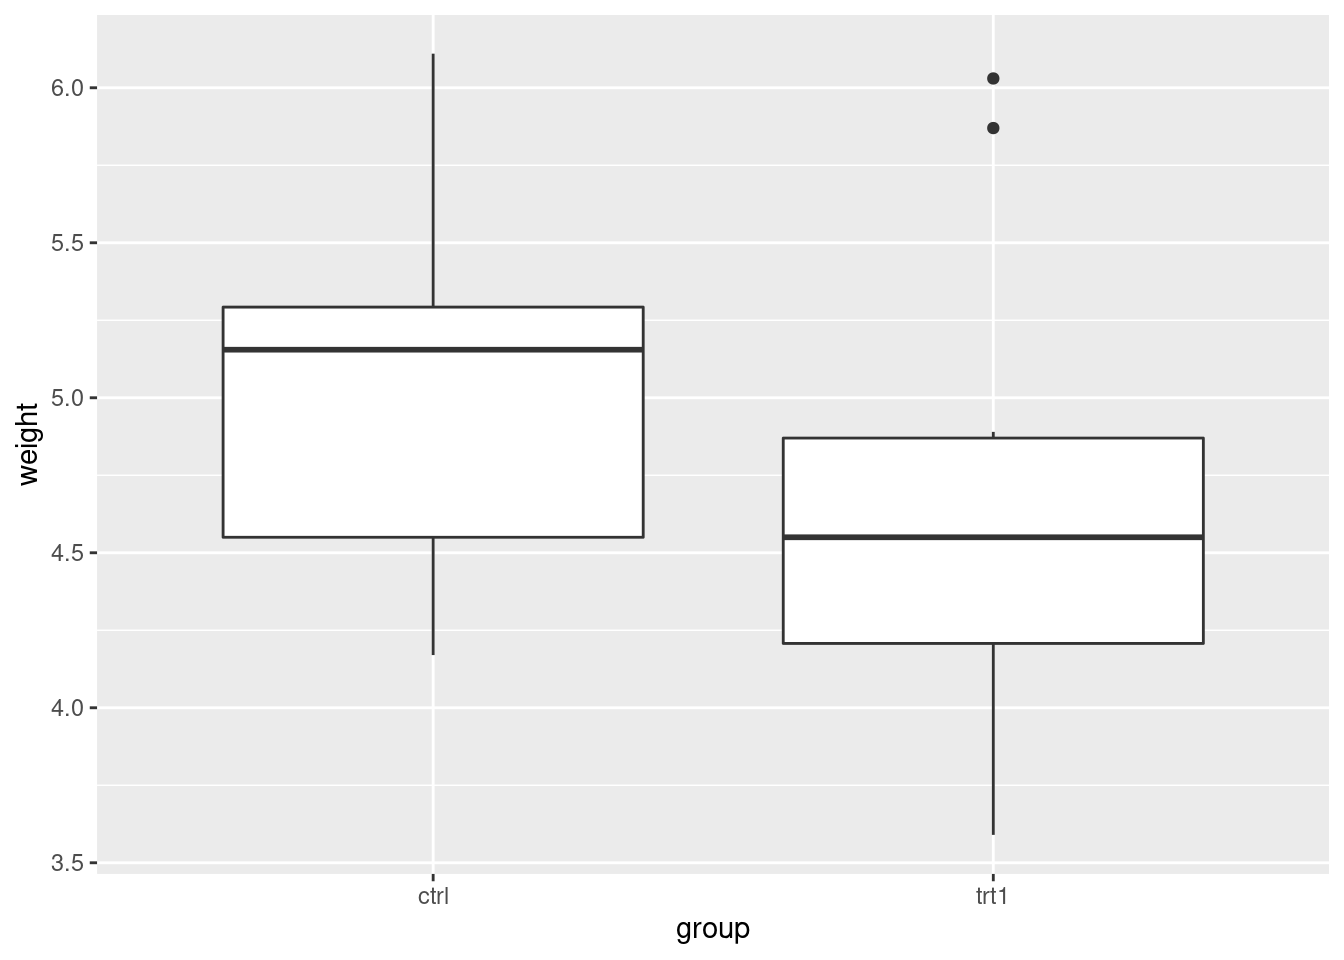
Fixed coordenades
m_plot <- ggplot(marathon, aes(x = Half,y = Full)) +
    geom_point()

m_plot +
coord_fixed() 
m_plot +
    coord_fixed() +
    scale_y_continuous(breaks = seq(0, 420, 30)) +
    scale_x_continuous(breaks = seq(0, 420, 30))
m_plot +
    coord_fixed(ratio = 1/2) +
    scale_y_continuous(breaks = seq(0, 420, 30)) +
    scale_x_continuous(breaks = seq(0, 420, 15))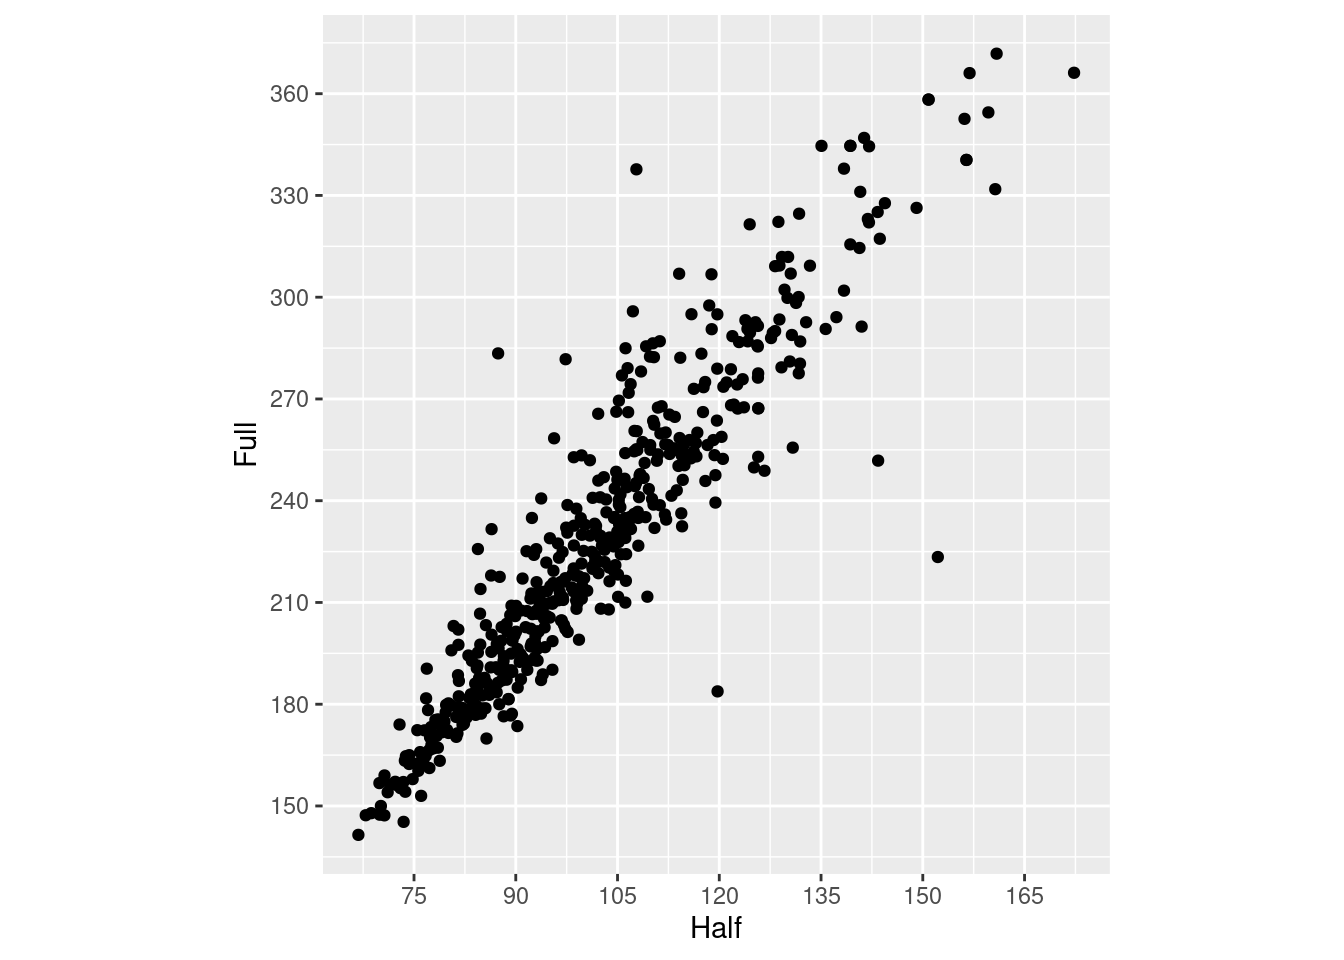
Pie chart (axis coord polar)
ggplot(wind, aes(x = DirCat, fill = SpeedCat)) +
    geom_histogram(binwidth = 15, boundary = -7.5) +
    coord_polar() +
    scale_x_continuous(limits = c(0,360))
ggplot(wind, aes(x = DirCat, fill = SpeedCat)) +
geom_histogram(binwidth = 15,
               boundary = -7.5,
               colour = "black",
               size = .25)+
    guides(fill = guide_legend(reverse = TRUE)) +
    coord_polar() +
    scale_x_continuous(limits = c(0,360),
                       breaks = seq(0, 360, by = 45),
                       minor_breaks = seq(0, 360, by = 15)) +
    scale_fill_brewer()