Animated graphics with ggplot2 and gganimate

Sometimes you want to present a result or an analysis in a attractive way to call the attention, to create better slides or you want to show progress or the change of a variable on a period of time. In those cases usually is useful make an animated or interactive plot to impact.
This time we are going to use ggplot2 to create the plots gganimate to create GIFs and other output formats and ploty to create interactive plots, also we are going to use rats dataset, that contains the weight data of four rats each of them under different diets by thirty days.
Load libraries required
First of all, you have to load the libraries that you need to wrangle the data and to create the plots.
library(tidyverse)
library(gganimate)
library(plotly)
library(openxlsx)
NOTE: you don’t have to load directly ggplot2 package because this is part of tidyverse.
Importing the dataset
As our dataset is contained in a .xlsx (an excel format) we are going to use. read.xlsx() from openxlsx.
rats <- read.xlsx("rat_w.xlsx")
We are going to display the first six rows of our data set and use str() function to understand how is organized the rats object.
head(rats) %>% as_hux() %>% theme_blue()
| Specimen | Day | Weight |
|---|---|---|
| A | 1 | 110 |
| A | 2 | 107 |
| A | 3 | 106 |
| A | 4 | 109 |
| A | 5 | 109 |
| A | 6 | 100 |
str(rats)
## 'data.frame':    120 obs. of  3 variables:
##  $ Specimen: chr  "A" "A" "A" "A" ...
##  $ Day     : num  1 2 3 4 5 6 7 8 9 10 ...
##  $ Weight  : num  110 107 106 109 109 100 115 103 107 115 ...
Creating plots
R base
We are going to made a histogram to see the general weight distribution, this a pretty informative plot, but to be honest it is not attractive.
hist(rats$Weight)

With ggplot
Other problem with the last plot is it don’t take on count how the weight changes over time, to visualize this, it is more suitable create a line plot with ggplot2.
static_plot <- rats %>%
        ggplot(aes(x = Day, y = Weight, color = Specimen)) +
        geom_line(size = 2) +
        theme_bw()

static_plot

Animating our plot
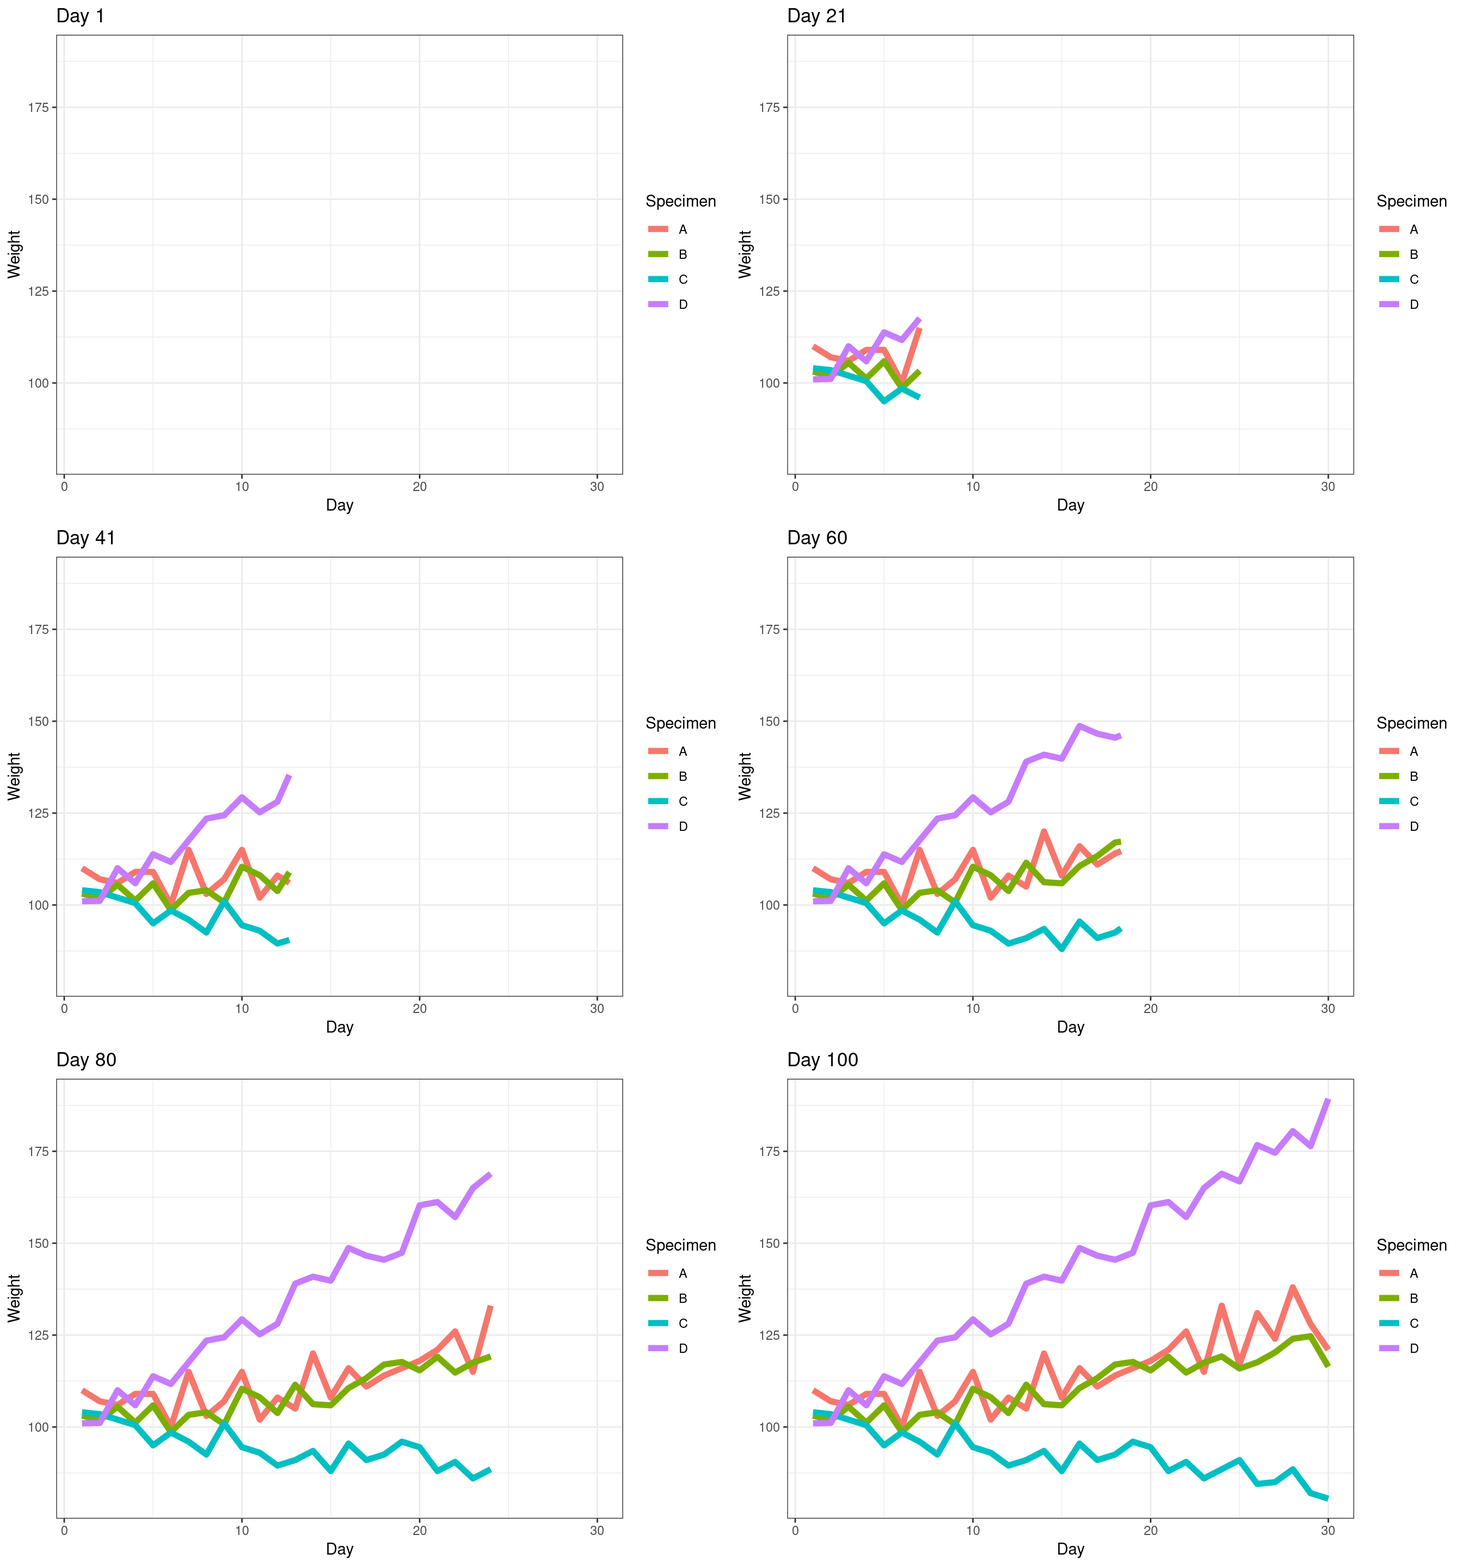
With gganimate we can create different formats to animate our plots, in the next example we are going to create a GIF, this is the default output format. To integrate gganimate with ggplot2 we use transition_reveal() function.
animated_plot <- rats %>% ggplot(aes(x = Day, y = Weight, color = Specimen)) +
        geom_line(size = 2) +
        theme_bw()+
        labs(title = "Day {frame}") +
        transition_reveal(Day)

animated_plot

Creating a interactive plot
With the function ggplotly() from plotly package you can use a ggplot object and tranform it in a an interactive plot.
ggplotly(static_plot)
Exporting our plots
To export static plots there are two main options, first is using dev.off() to export your plot with different formats such as PNG, JPEG, TIFF, PDF and SVG, on the next example we are going to export our static plot as PDF.
pdf("static_plot.pdf")
static_plot
dev.off()
Once you have done this you will get a PDF like this static_plot.pdf, if you want other format instead PDF you just have to change pdf() function for other such as tiff(), png() and so on.
Other option is to use ggsave() from ggplo2 package.
ggplot2.
ggsave(filename = "static_plot.pdf", path = "Home/", device = "pdf" )
If you do not specify the plot that you want to export ggsave() will use the last plot created, also you can change the width, height, resolution and other features exploring the arguments that can be used for this function like device that determine de output format.
To export animated plot you have to use animate() function.
anim_save("animated_plot.gif", animated_plot, path = "../Rmd_sorted/") #gif
Or export a video have to use renderer argument like this, precise how long will it take and the quality; this file will be saved on your temporary files.
animate(animated_plot,
        nframes = 150,
        renderer =  av_renderer()) %>%
  save_animation(.,"../Rmd_sorted/") %>%
  anim_save("animated_plot",
            path = "../Rmd_sorted/")#video